Even small data sets can yield insights

Even small data sets can yield insights

Joey Cherdarchuk

Mar 28, 2012

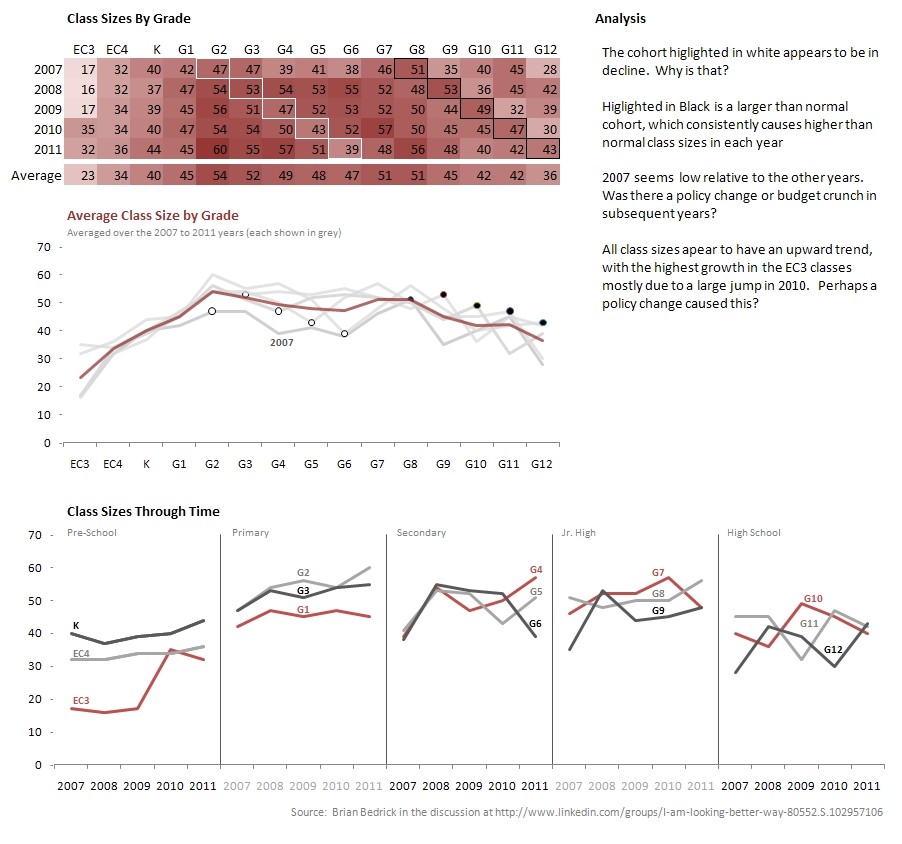
Recently a small data set was posted on a discussion board I read.  5 columns by 15 rows.  This small bit of data yielded an immense number of opinions and visualizations.

Grade 07 08 09 10 11
EC3 17 16 17 35 32
EC4 32 32 34 34 36
Kind 40 37 39 40 44
Grade 1 42 47 45 47 45
Grade 2 47 54 56 54 60
Grade 3 47 53 51 54 55
Grade 4 39 54 47 50 57
Grade 5 41 53 52 43 51
Grade 6 38 55 53 52 39
Grade 7 46 52 52 57 48
Grade 8 51 48 50 50 56
Grade 9 35 53 44 45 48
Grade 10 40 36 49 45 40
Grade 11 45 45 32 47 42
Grade 12 28 42 39 30 43

Below is my interpretation, inspired mainly by a submission by Bruce Segal (which you can see here).

screenshot.104

Consider trying the data out yourself and see what insights you can find.  The full discussion can be found at LinkedIn.

Newsletter

Get monthly case studies, best practices, and inspiration on how to create more impact from your data.

Newsletter

Get monthly case studies, best practices, and inspiration on how to create more impact from your data.

Newsletter

Get monthly case studies, best practices, and inspiration on how to create more impact from your data.

Newsletter

Get monthly case studies, best practices, and inspiration on how to create more impact from your data.

10139 81 Avenue NW
Edmonton, AB T6E 1W9
Canada

1-800-261-1832

© Darkhorse Visualization 2026 · All Rights Reserved

10139 81 Avenue NW
Edmonton, AB T6E 1W9
Canada

1-800-261-1832

© Darkhorse Visualization 2026 · All Rights Reserved

10139 81 Avenue NW
Edmonton, AB T6E 1W9
Canada

1-800-261-1832

© Darkhorse Visualization 2026 · All Rights Reserved

10139 81 Avenue NW
Edmonton, AB T6E 1W9
Canada

1-800-261-1832

© Darkhorse Visualization 2026 · All Rights Reserved