Payroll and Playoffs

Payroll and Playoffs

Joey Cherdarchuk

Apr 24, 2012


screenshot.165


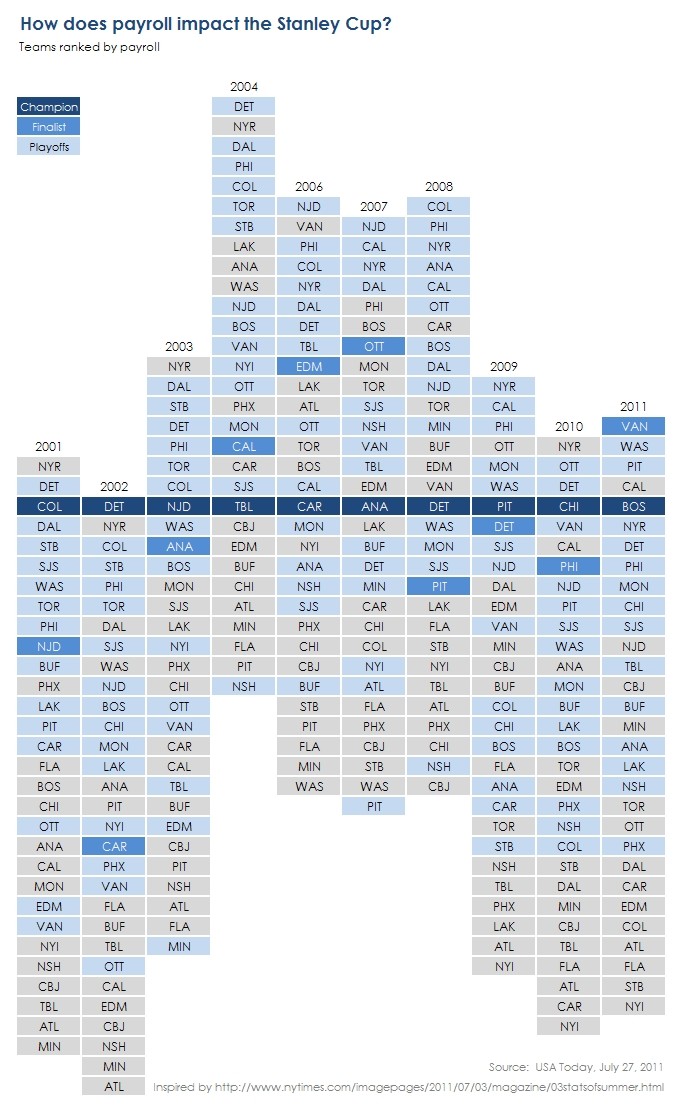
The NHL playoffs are underway and so some visual analytics are in order.  Inspired by Craig Robinson's graphic for Major League Baseball, we've put together a chart that looks at the relationship between payroll and Stanley Cup Championships over the past 10 seasons.

Newsletter

Get monthly case studies, best practices, and inspiration on how to create more impact from your data.

Newsletter

Get monthly case studies, best practices, and inspiration on how to create more impact from your data.

Newsletter

Get monthly case studies, best practices, and inspiration on how to create more impact from your data.

Newsletter

Get monthly case studies, best practices, and inspiration on how to create more impact from your data.

10139 81 Avenue NW
Edmonton, AB T6E 1W9
Canada

1-800-261-1832

© Darkhorse Visualization 2026 · All Rights Reserved

10139 81 Avenue NW
Edmonton, AB T6E 1W9
Canada

1-800-261-1832

© Darkhorse Visualization 2026 · All Rights Reserved

10139 81 Avenue NW
Edmonton, AB T6E 1W9
Canada

1-800-261-1832

© Darkhorse Visualization 2026 · All Rights Reserved

10139 81 Avenue NW
Edmonton, AB T6E 1W9
Canada

1-800-261-1832

© Darkhorse Visualization 2026 · All Rights Reserved