
Eugene Chen
Feb 16, 2022

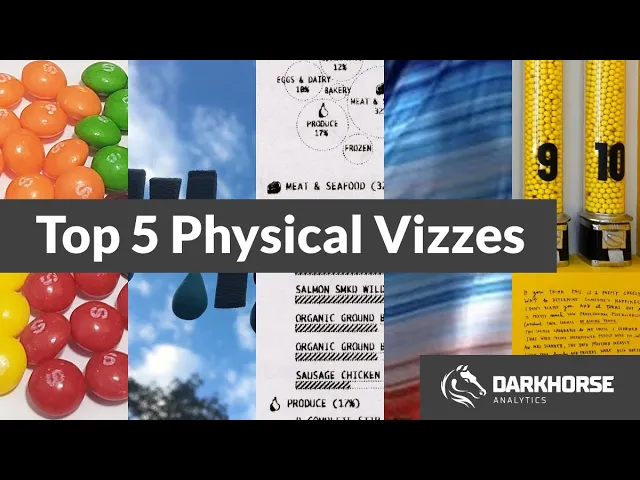
Using physical objects to display data and create visualizations may seem counterintuitive, but doing so can be incredibly effective and engaging.
5 minute video: 5 of the Most Inspiring Physical Visualizations we’ve come across
It takes more effort to reproduce them than their digital counterparts, but there’s novelty in engaging our other senses in experiencing data differently. You can smell candy, touch or move playdoh, and feel the gradients of a 3D printed map. You can arrange charts differently with your hands or measure scale with sound.
The video above showcases 5 of the most inspiring physical visualizations we’ve come across.
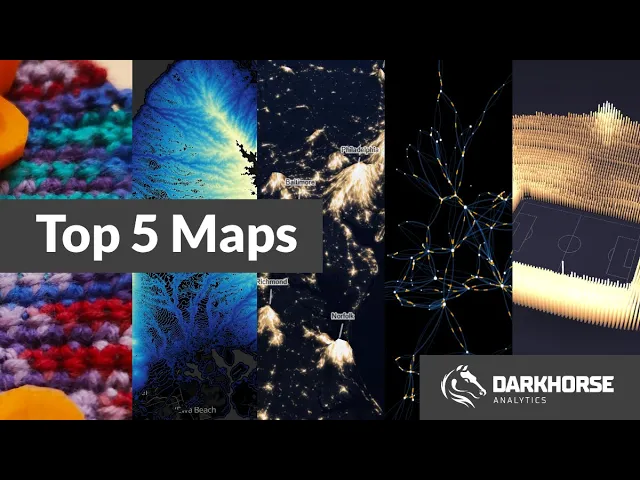
In case you missed it, this is last week’s video of the Top 5 Maps.
