We transform complex research into visual stories people actually understand—and act on.
When it matters most—when funding hangs in the balance, when policy needs shifting, when communities need proof—leading organizations turn to us.

Your Data has a
Communication problem
How We Solve These Problems
1
We make complex data understandable
WHAT WE DO
Transform sophisticated research into clear insights without dumbing it down.
HOW IT WORKS
We start with analysis, not aesthetics. We know when to aggregate (noise) and when to preserve detail (signal). We understand which precision matters to which audience. Then we design for how people actually process information—building understanding step by step, respecting what the brain can handle.
What you get
Funders grasp your impact. Policymakers understand implications. Your phenomena become comprehensible without becoming lies.
From our Portfolio
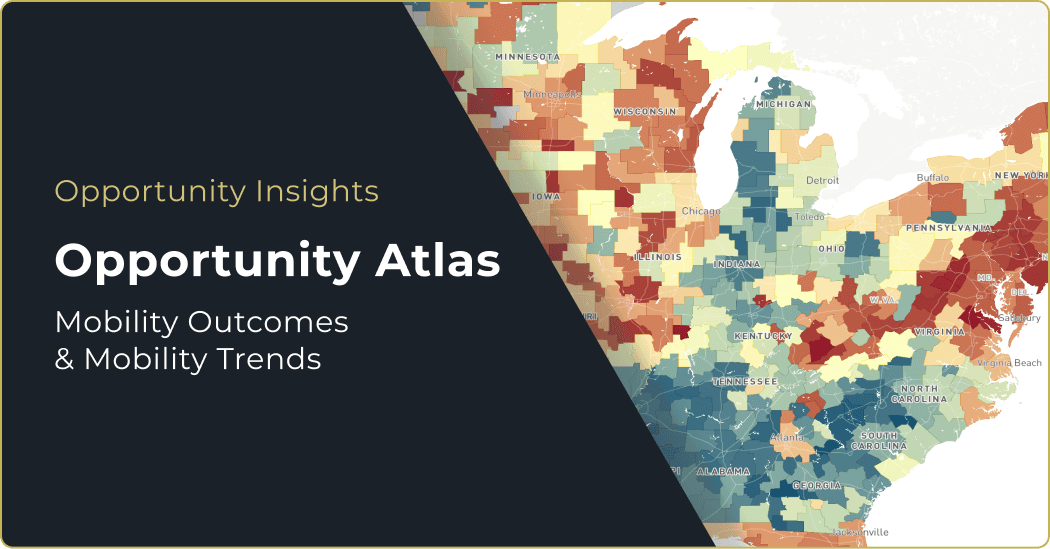
Opportunity Atlas
30 years of mobility research, now used daily by housing advocates.
From our Portfolio
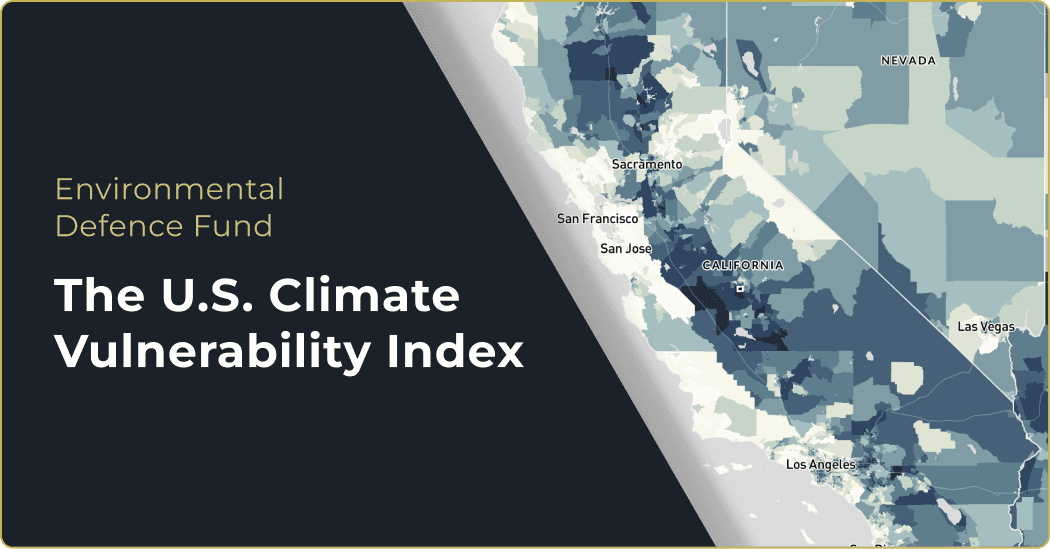
Climate Vulnerability Index
Making climate risk real for 70,000 communities.
2
We help difficult findings land
WHAT WE DO
Create experiences that let skeptics discover your truth for themselves.
HOW IT WORKS
We start where your audience is, not where you wish they were. Personal stories create connection before data. Interactive exploration replaces lectures. When users can filter to their own city, their own demographic, their own situation, defensive walls drop. They're not being told; they're discovering.
What you get
Critics engage with substance because they're emotionally engaged. Hostile audiences can't dismiss what they've found themselves.
3
We build once, reach thousands
WHAT WE DO
Create systems where users find their own story in your data.
HOW IT WORKS
We architect for scale from day one. Billions of records, but users see only what matters to them. Navigation that feels obvious. Sharing that's seamless—PDF for the board, image for the grant, link for the colleague. Same infrastructure serves researchers and residents.
What you get
Local newspapers cite your neighborhood data. City councils debate using your analysis. Every user becomes a potential advocate.

A DIFFERENT KIND OF VISUALIZATION PARTNER
Built on academic rigor,
designed for real-world impact
Our founders spent over a decade in university research centers. We've published papers, won grants, and still teach undergrads.
When we took that rigor into the real world, we learned something crucial: being right is only half the battle. Convincing people is the other half.
Data visualization became our bridge between insight and action. It worked so well that we transformed our entire company—from Darkhorse Analytics (data science) to Darkhorse Visualization (data storytelling).
Today, that evolution gives you an edge. We understand research because we've done it. We know what rigorous analysis requires—and what it takes to make it resonate.
No translation needed.
What makes us different from your other options
Design agencies make things beautiful but miss the nuance. They don't know why confidence intervals matter or how aggregation can hide crucial variation.
In-house teams could try, but visualization is a specialized craft. You wouldn't ask your communications director to run regression analyses.
Big tech platforms offer templates that either oversimplify or overwhelm. Your work doesn't fit in their boxes.
Freelancers might cost less initially, but what happens when they're unavailable? When their code breaks? We build for the long term.
We're the rare partner who satisfies both your researchers and your stakeholders. Because the goal isn't just to inform—it's to create understanding that leads to action.


YOUR NEXT STEP
What to expect

Investment

Timeline

Deliverables
Ready to start?

We intentionally limit the number of active projects so your team gets our full attention. To keep things fair, we schedule new starts on a first-commit, first-served basis.
Not ready yet?
Explore
Our blog on visualization, transparency, and the future of research communication