
Darkhorse Analytics is proud to announce the launch of its newest visualizations, the AIDSVu and HepVu Interactive Maps.
Developed in partnership with the Rollins School of Public Health at Emory University and Gilead Sciences, AIDSVu and HepVu use feature-rich interactive maps and polished location profile reports to offer an in-depth understanding of the impact of HIV and viral hepatitis across the United State
AIDSVu: Empowering Public Health with Data-Driven Insights
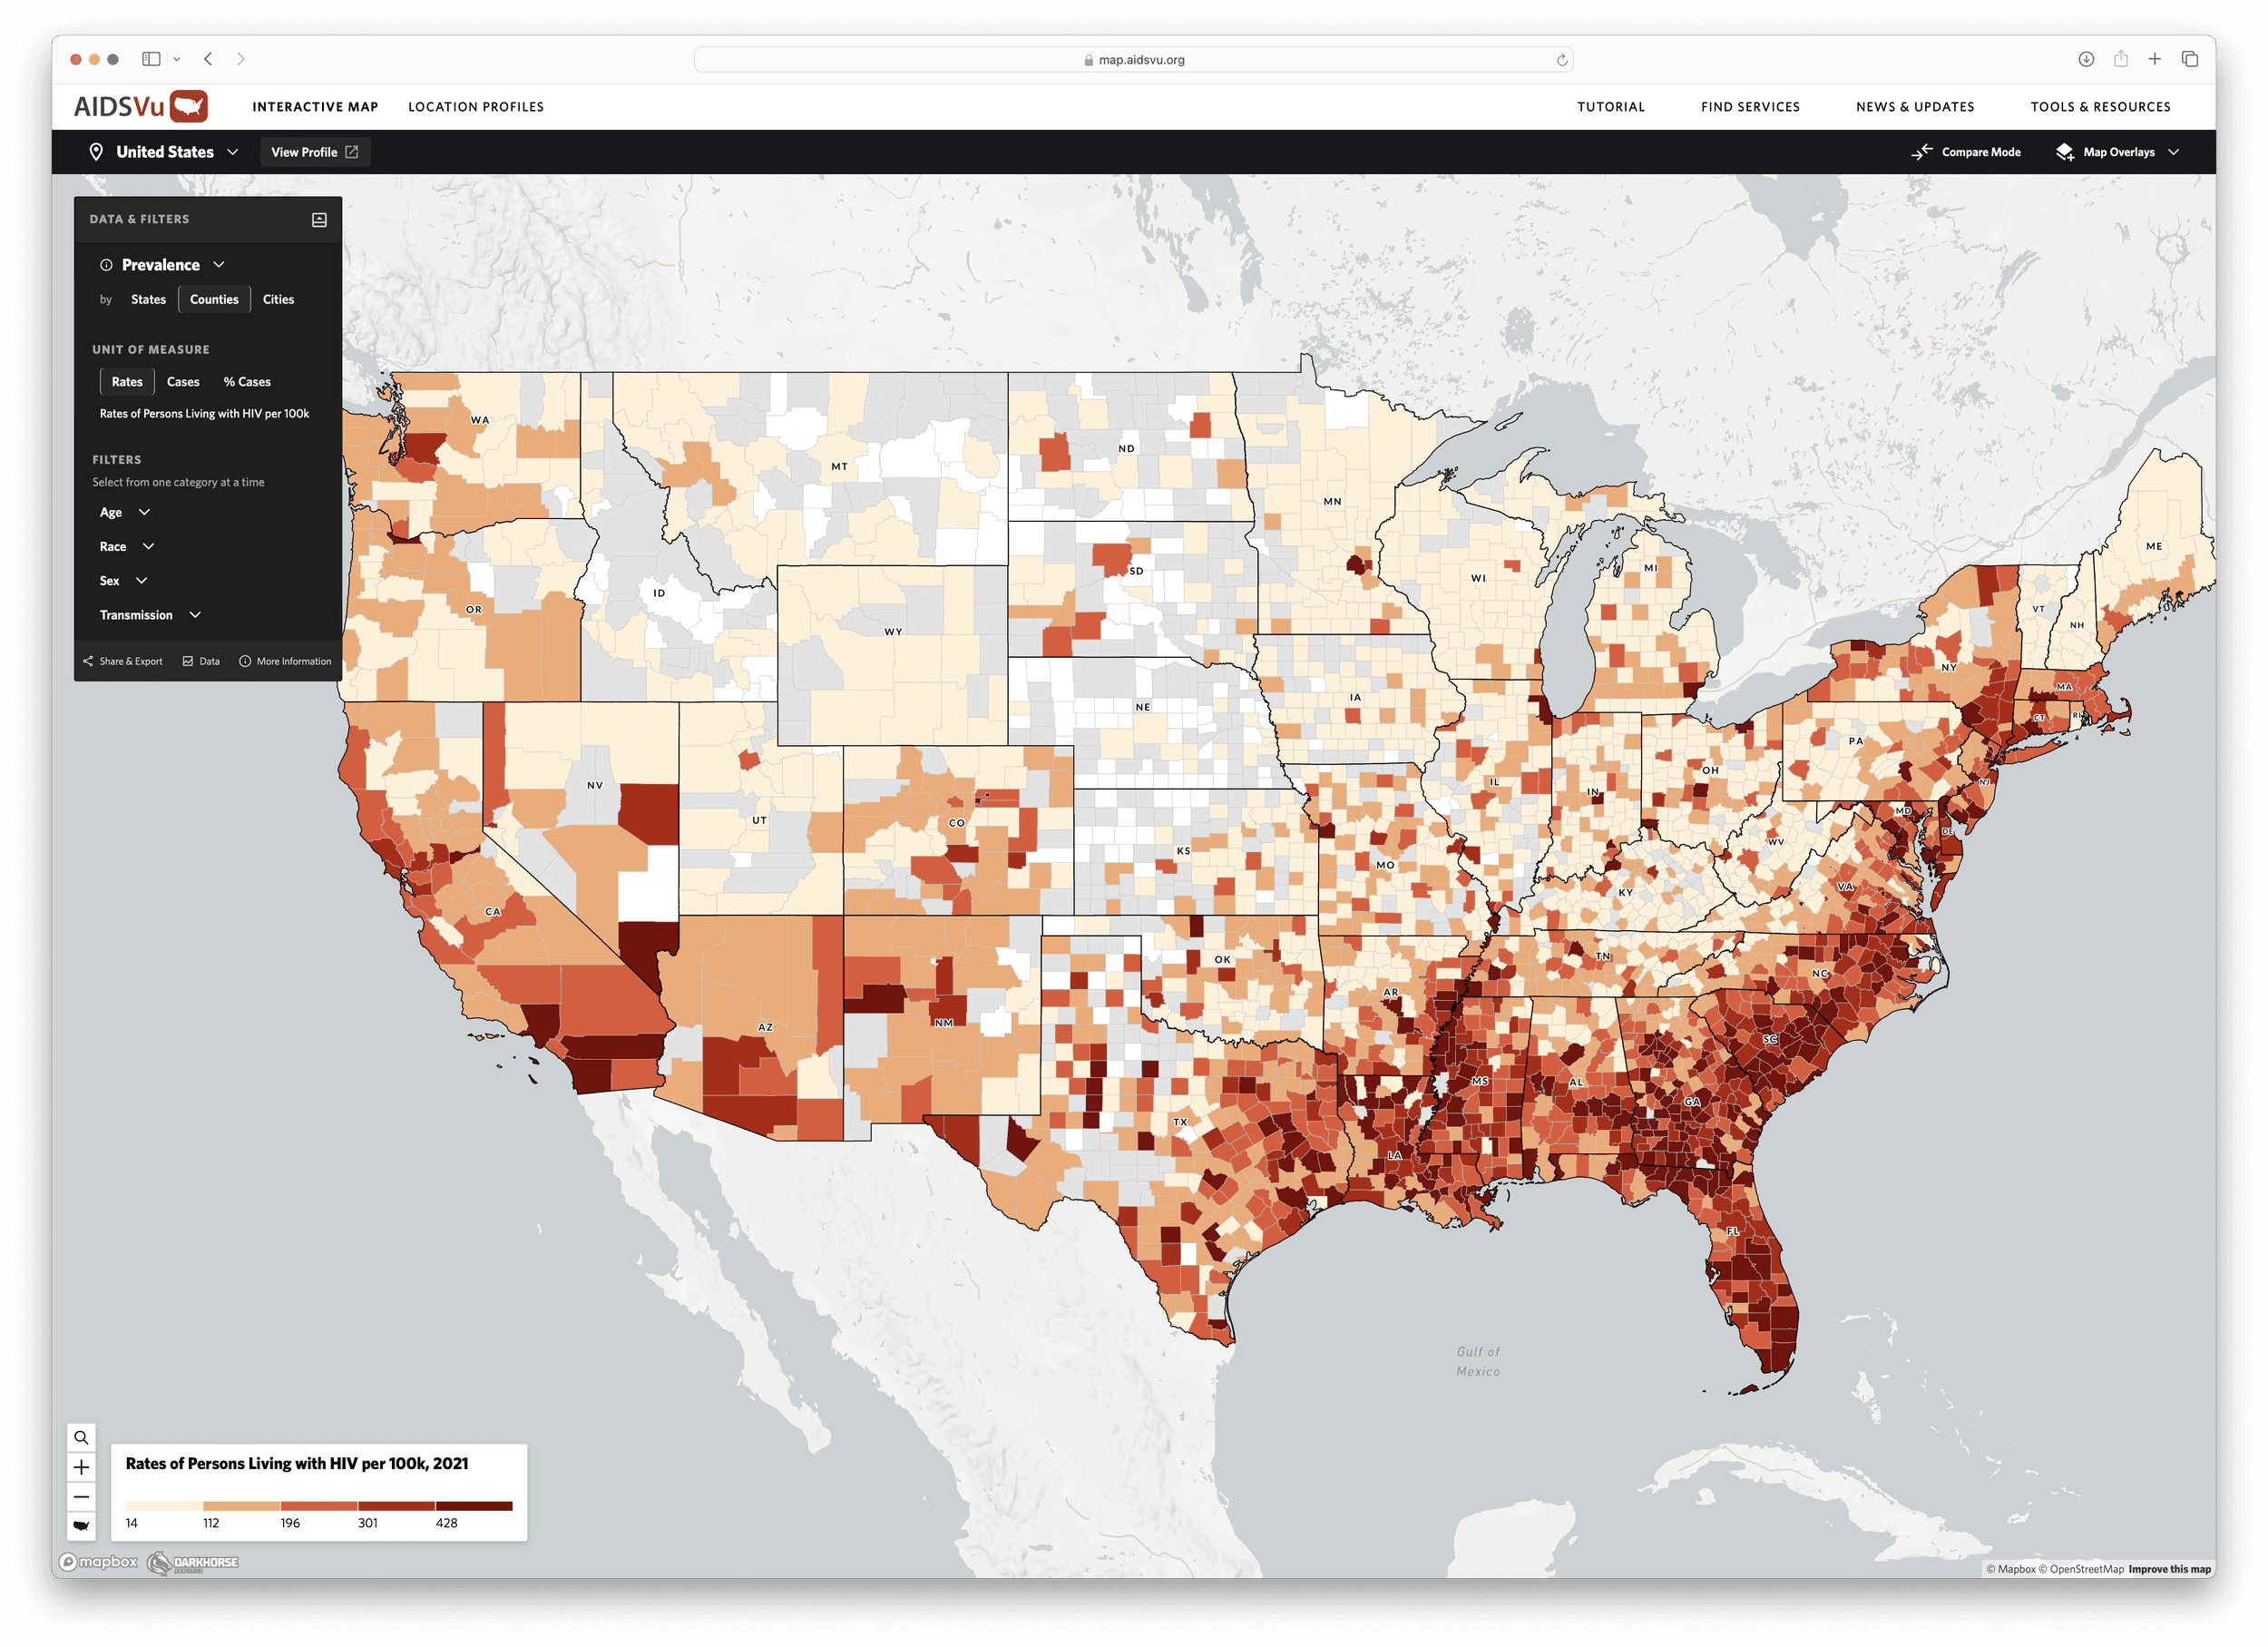
AIDSVu.org is an innovative online mapping tool designed to reveal the impact of the HIV epidemic on communities throughout the United States. By increasing disease awareness and promoting data-driven public health decisions, AIDSVu aims to empower policymakers, researchers, and interventionists to address critical challenges and make significant impacts.
Through data storytelling, Darkhorse Analytics has simplified complex data, making it accessible and actionable. The AIDSVu Interactive Maps help users to:
Identify Underserved Areas: Pinpoint where resources are needed most.
Uncover Targeted Insights: Understand how HIV affects specific communities based on race, sex, and other factors.
Track Policy Impact: Monitor trends to measure the effectiveness of policies.
These tools empower public health decision-makers to understand underserved areas and evaluate the effectiveness of their policies. Additionally, local advocates can use the data to support applications and petitions for increased HIV funding.
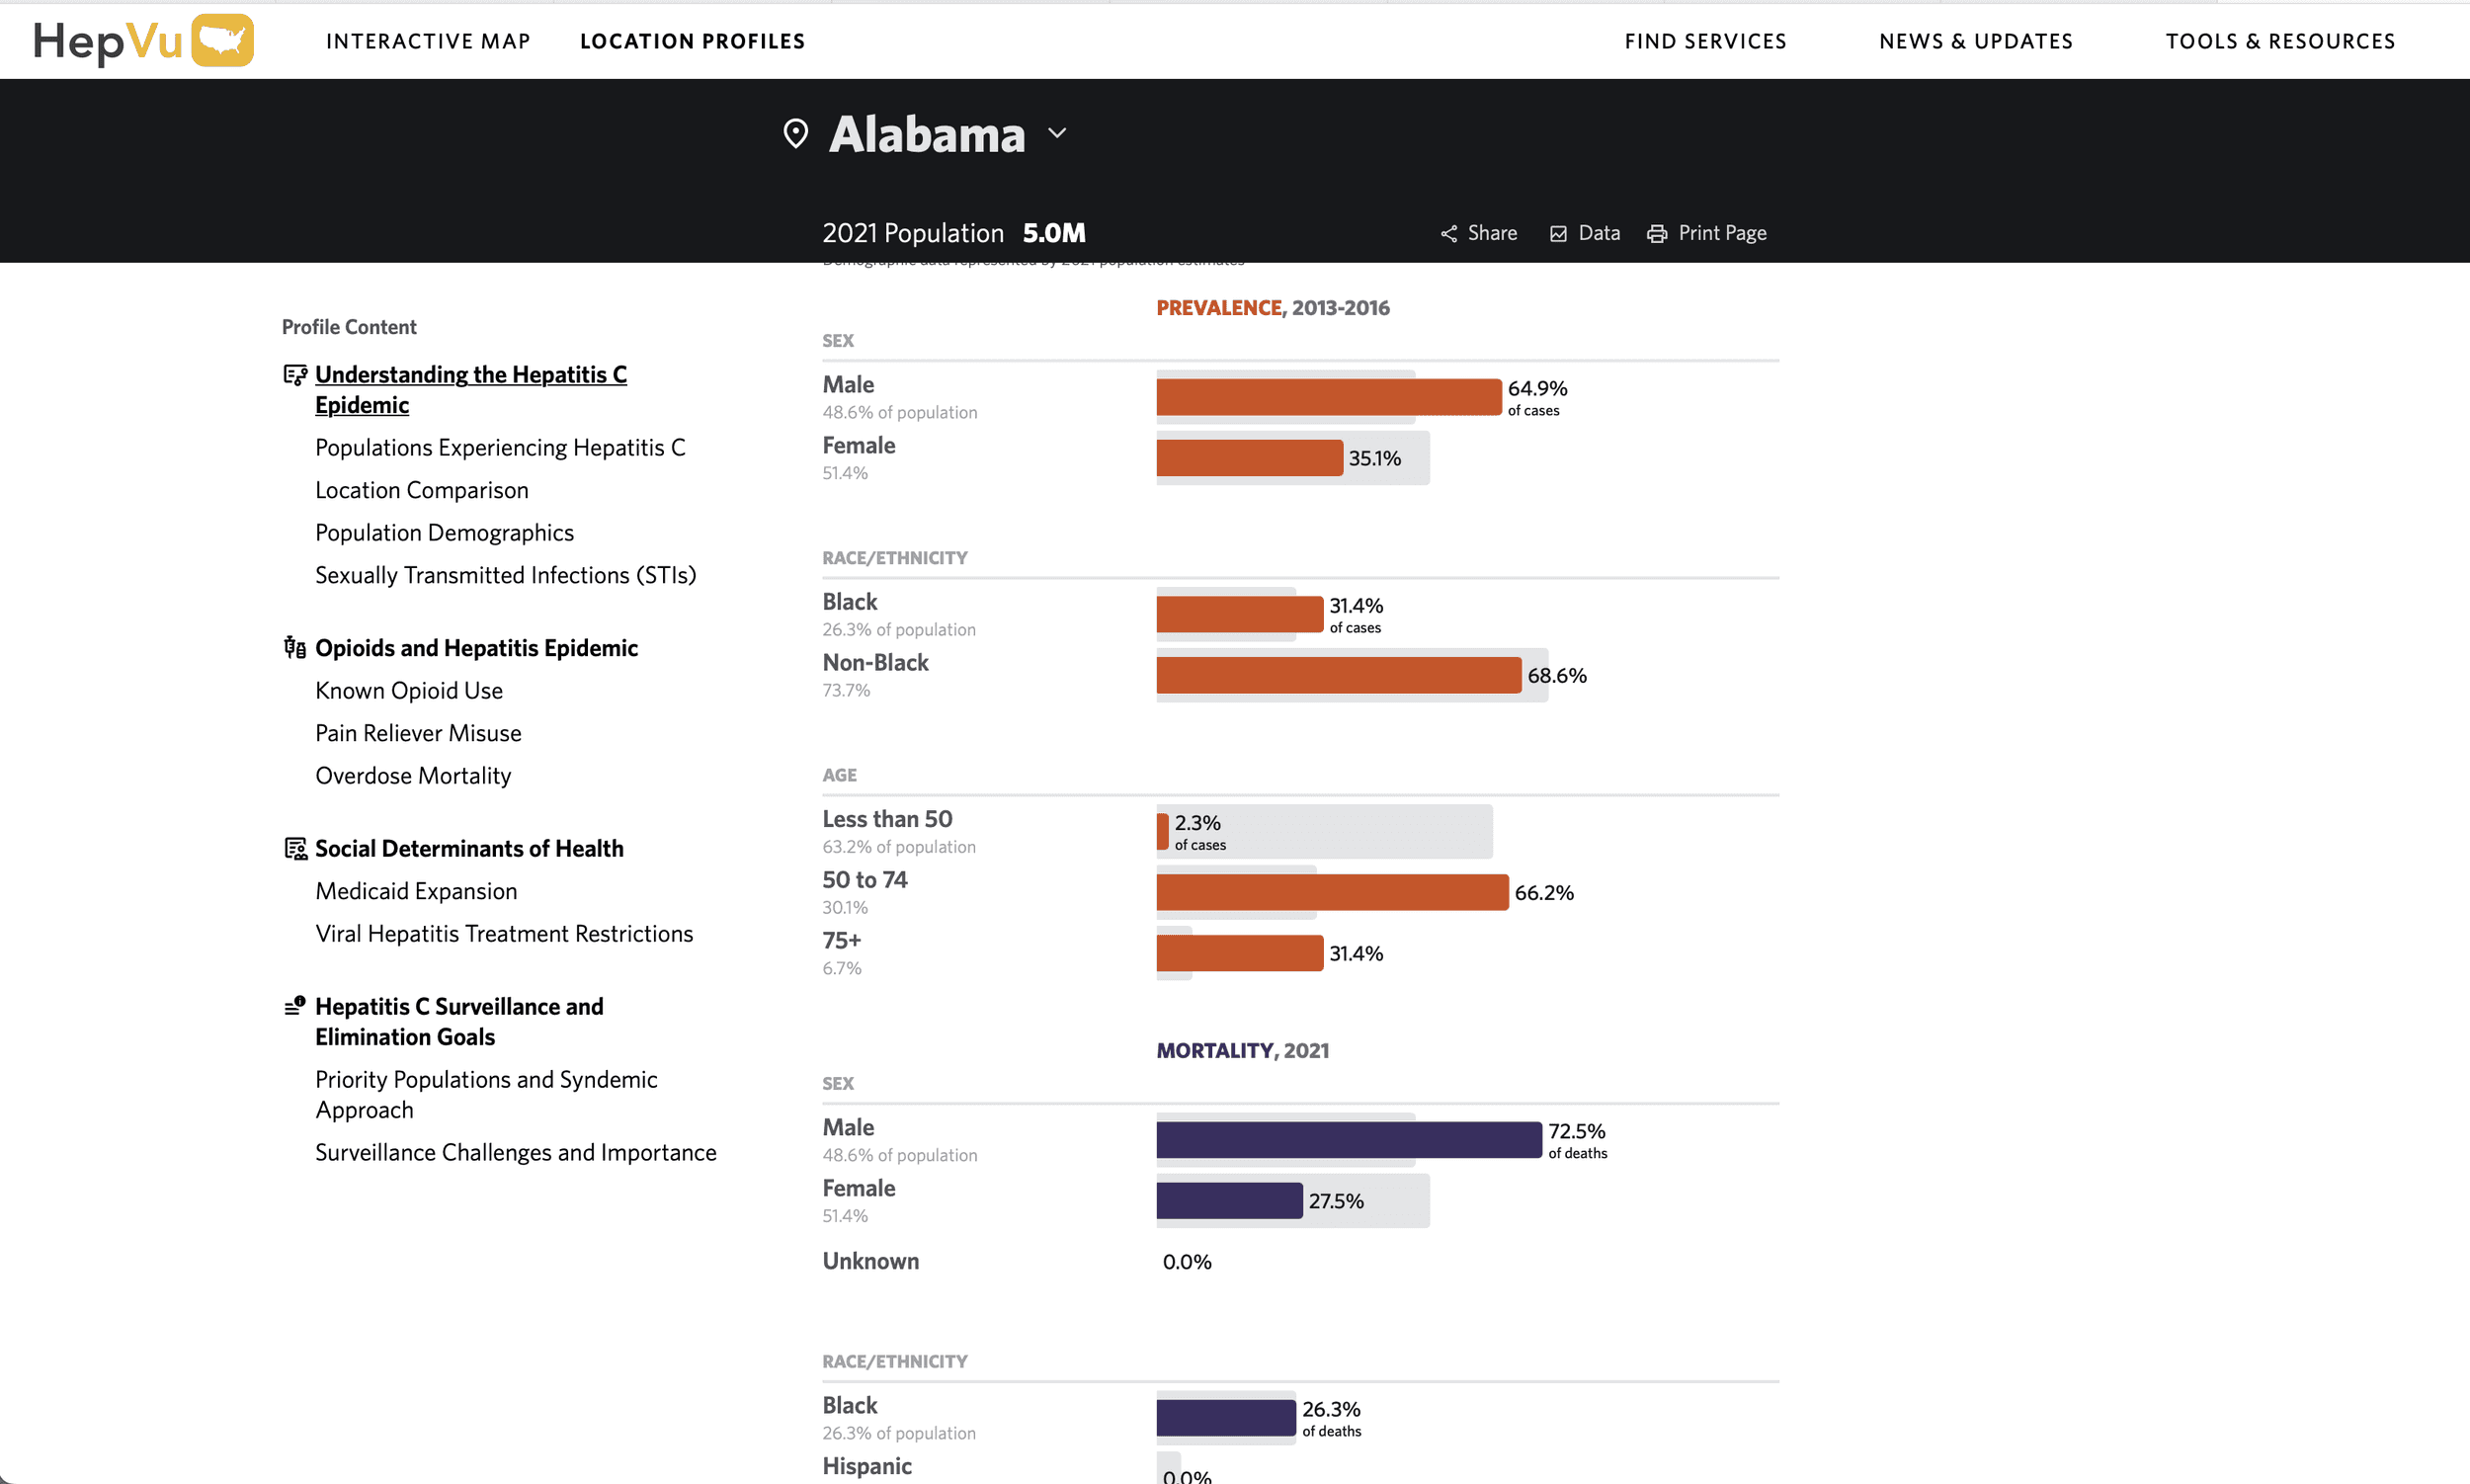
HepVu: Visualizing the Impact of Viral Hepatitis
Alongside AIDSVu, Darkhorse Analytics has also launched the HepVu interactive mapping tool focused on visualizing the impact of viral hepatitis in the United States. HepVu provides similar tools and insights to support public health initiatives, using data from reliable sources to help users understand the prevalence and impact of viral hepatitis across various demographics and social factors.
For more information about the AIDSVu Interactive Map and Location Profiles, visit https://map.aidsvu.org and for HepVu, visit https://map.hepvu.org.
About Darkhorse Analytics:
At Darkhorse Analytics, we specialize in turning complex data into clear, actionable insights through cutting-edge visualization solutions.
Our innovative approach empowers organizations to make informed decisions with confidence. With a relentless commitment to impact, we transform complex data into bespoke visualizations that drive meaningful outcomes.
Want to see more?
Explore more of our data visualization solutions that transform information into insight.