
Challenge
Can we bring additional insight to parents researching schools in their area? The Alberta government hosted the Apps for Alberta competition to encourage the development of creative tools that provide economic or social value using Alberta’s open data. Digging into the available information, we identified a rich data set of high school grades that we felt could be more valuable to the public, especially parents, if it was communicated visually and interactively.
Solution
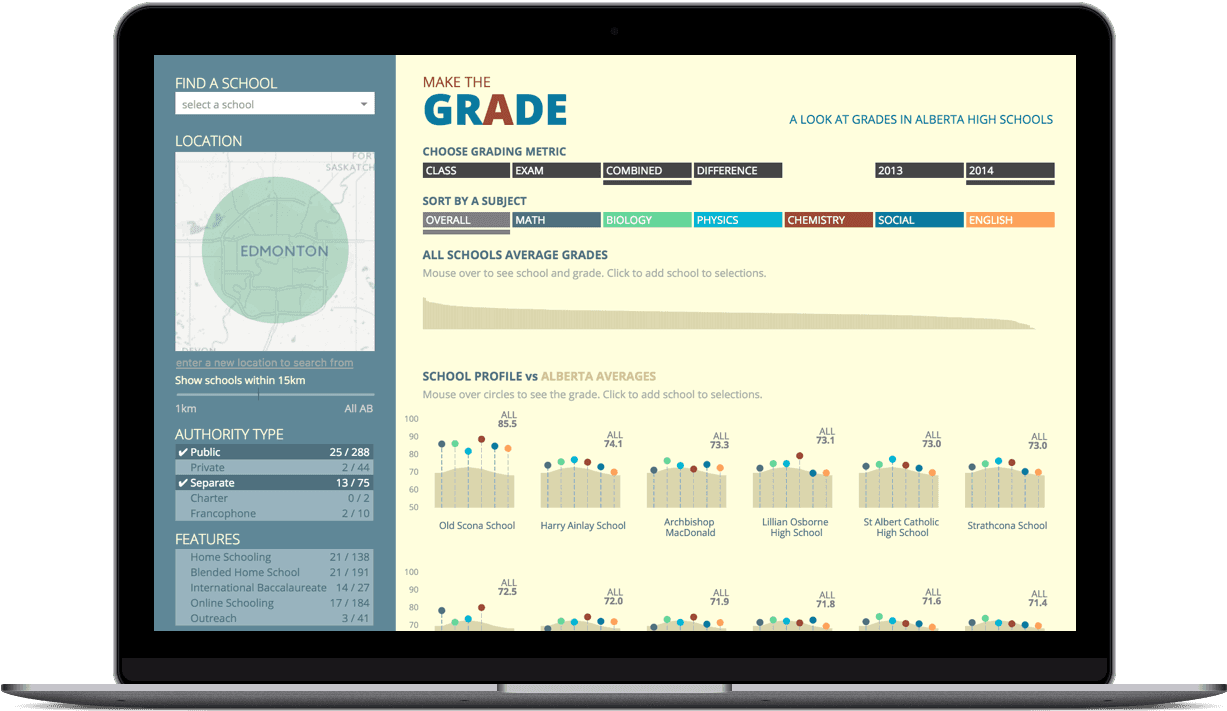
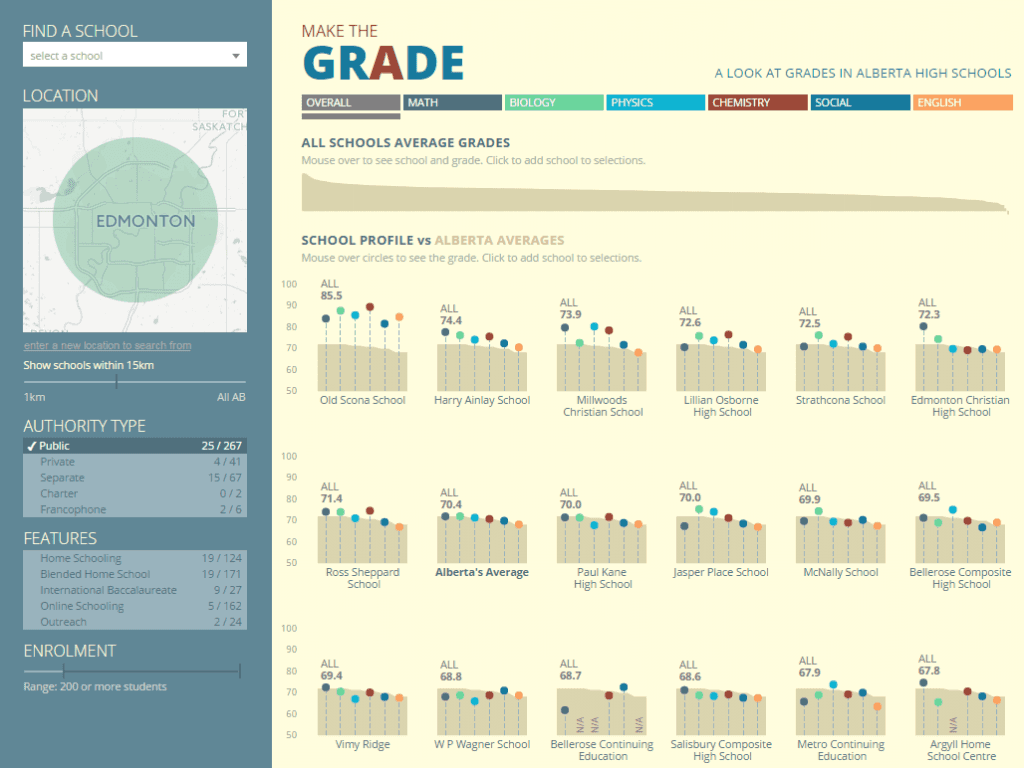
We began with the questions a parent might ask. What are the schools in my area? How do they compare overall? Across subjects? What about a specific school? How does it rank in the province? We then focused on designing something to make answering those questions simple and clear.
In the end, our tool automatically identifies your location and sorts schools within its radius by their overall grade. It affords quick and animated search, selection, filtering, and sorting to explore and understand the grades, revealing information such as private schools’ tendency toward higher grades, or the unexpectedly high grades of Social Studies students in St. Francis Xavier High.
Result
The visualization won two awards: the Best Made in Alberta App and the Best Overall App. Contest officials were thrilled with the visualization and our project was deemed the best out of 28 other submissions from around the world. To them, the app showcases just how valuable open data and open data collaboration can be to the public.
Blog
Recently the Alberta government hosted Apps for Alberta - a competition using the province’s open data. Being an Alberta-based data visualization firm, we felt encouraged, perhaps even duty-bound, to enter. So we did. We managed to pull together a couple submissions, the first of which is a look at high school grades in the province.
In an ideal world, you start by asking: What question am I helping to answer? Then you go out and locate the most appropriate data available to help you answer that question and, because it is an ideal world, exactly the data you need is already there. It’s squeaky clean and accessible, just waiting to be visualized.
In the real world, data availability is often the limiting factor. You therefore start with the data you have and try to discover what questions it might help answer. If any of the question/answer combinations you discover end up engaging your curiosity, then you have a candidate for a visualization.
Such was the case with this competition. We poured through the available Alberta data sets looking for something that was interesting (engagement value) and relevant (societal value). Eventually we landed on the high school grades data.
Next we needed to define our audience. It’s easy to fall into the trap of defining an overly broad audience (e.g. the General Public). I mean, it’s on the Internet, right? The whole world is your audience. But there is a paradox: the more narrow your focus, the more engaging your application. We therefore defined our target user as “parents of children about to enter high school”. The application will answer some questions well rather than many questions poorly.
It’s also important to recognize the limitations of the data. Our audience's question might be "what is the best school for my child?" Our data can only answer "How do schools' grades compare?" There are a host of education quality concerns that aren't addressed by our data (e.g. the socio-economic status of the students, opportunities outside the classroom, etc.). And there are likely biases in the data collection (e.g. teaching to the test, cheating, small sample-size schools, or inconsistent grading criteria). But what we do have (average grade by school and subject) is still valuable.
As an aside, our visualization doesn't make claims it cannot possibly deliver on. Headlines like Find the Best School in Alberta or Where Do Schools Suck the Most? may pull in more hits on Reddit, but would be a disservice to the users of this tool and the teachers and institutions reported on. The socio-economic factors likely dominate any straight school-to-school comparison. Nevertheless, a more nuanced exploration reveals some interesting gems.
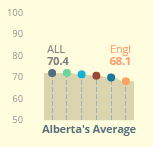
Students across the province seem to struggle with English more than the other subjects. Or perhaps English grading standards are higher.
Private schools are over-represented among the higher ranks (as you'd expect), but there are still some private schools for whom grades are not a primary focus.
Overall private schools' grades highlighted among a ranking of all schools in Alberta
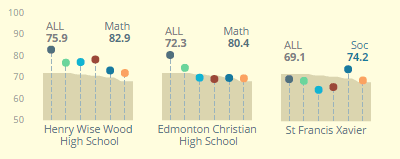
Our most interesting finding is in looking at intra-school grading. While most schools have fairly consistent scores across subjects, certain institutions appear to excel in a specific subject. By comparing within a school, we are naturally accounting for most of the socio-economic impact. So if my daughter wants to go into engineering, Henry Wise Wood might be an excellent choice with its strong Mathematics program. If I thought my son was destined for politics, I might point him toward St. Francis Xavier and its exceptional Social Studies program.
Play around with the tool and feel free to share your findings and feedback in the comments below.
Want to see more?
Explore more of our data visualization solutions that transform information into insight.