
How Darkhorse Visualization helped the University of Virginia turn complex economic research into an interactive global resource.
Darkhorse Visualization
Oct 8, 2026

The University of Virginia set out to answer a deceptively simple question: How do you measure capitalism?
Developed by UVA’s Democracy and Capitalism Lab and Darden School of Business, the Global Capitalism Index examines capitalism across eight dimensions, giving people a framework for comparing countries and understanding how their economic systems differ.
Darkhorse Visualization helped bring that research to the web through an interactive platform where visitors can explore rankings, compare countries, and examine changes over time.
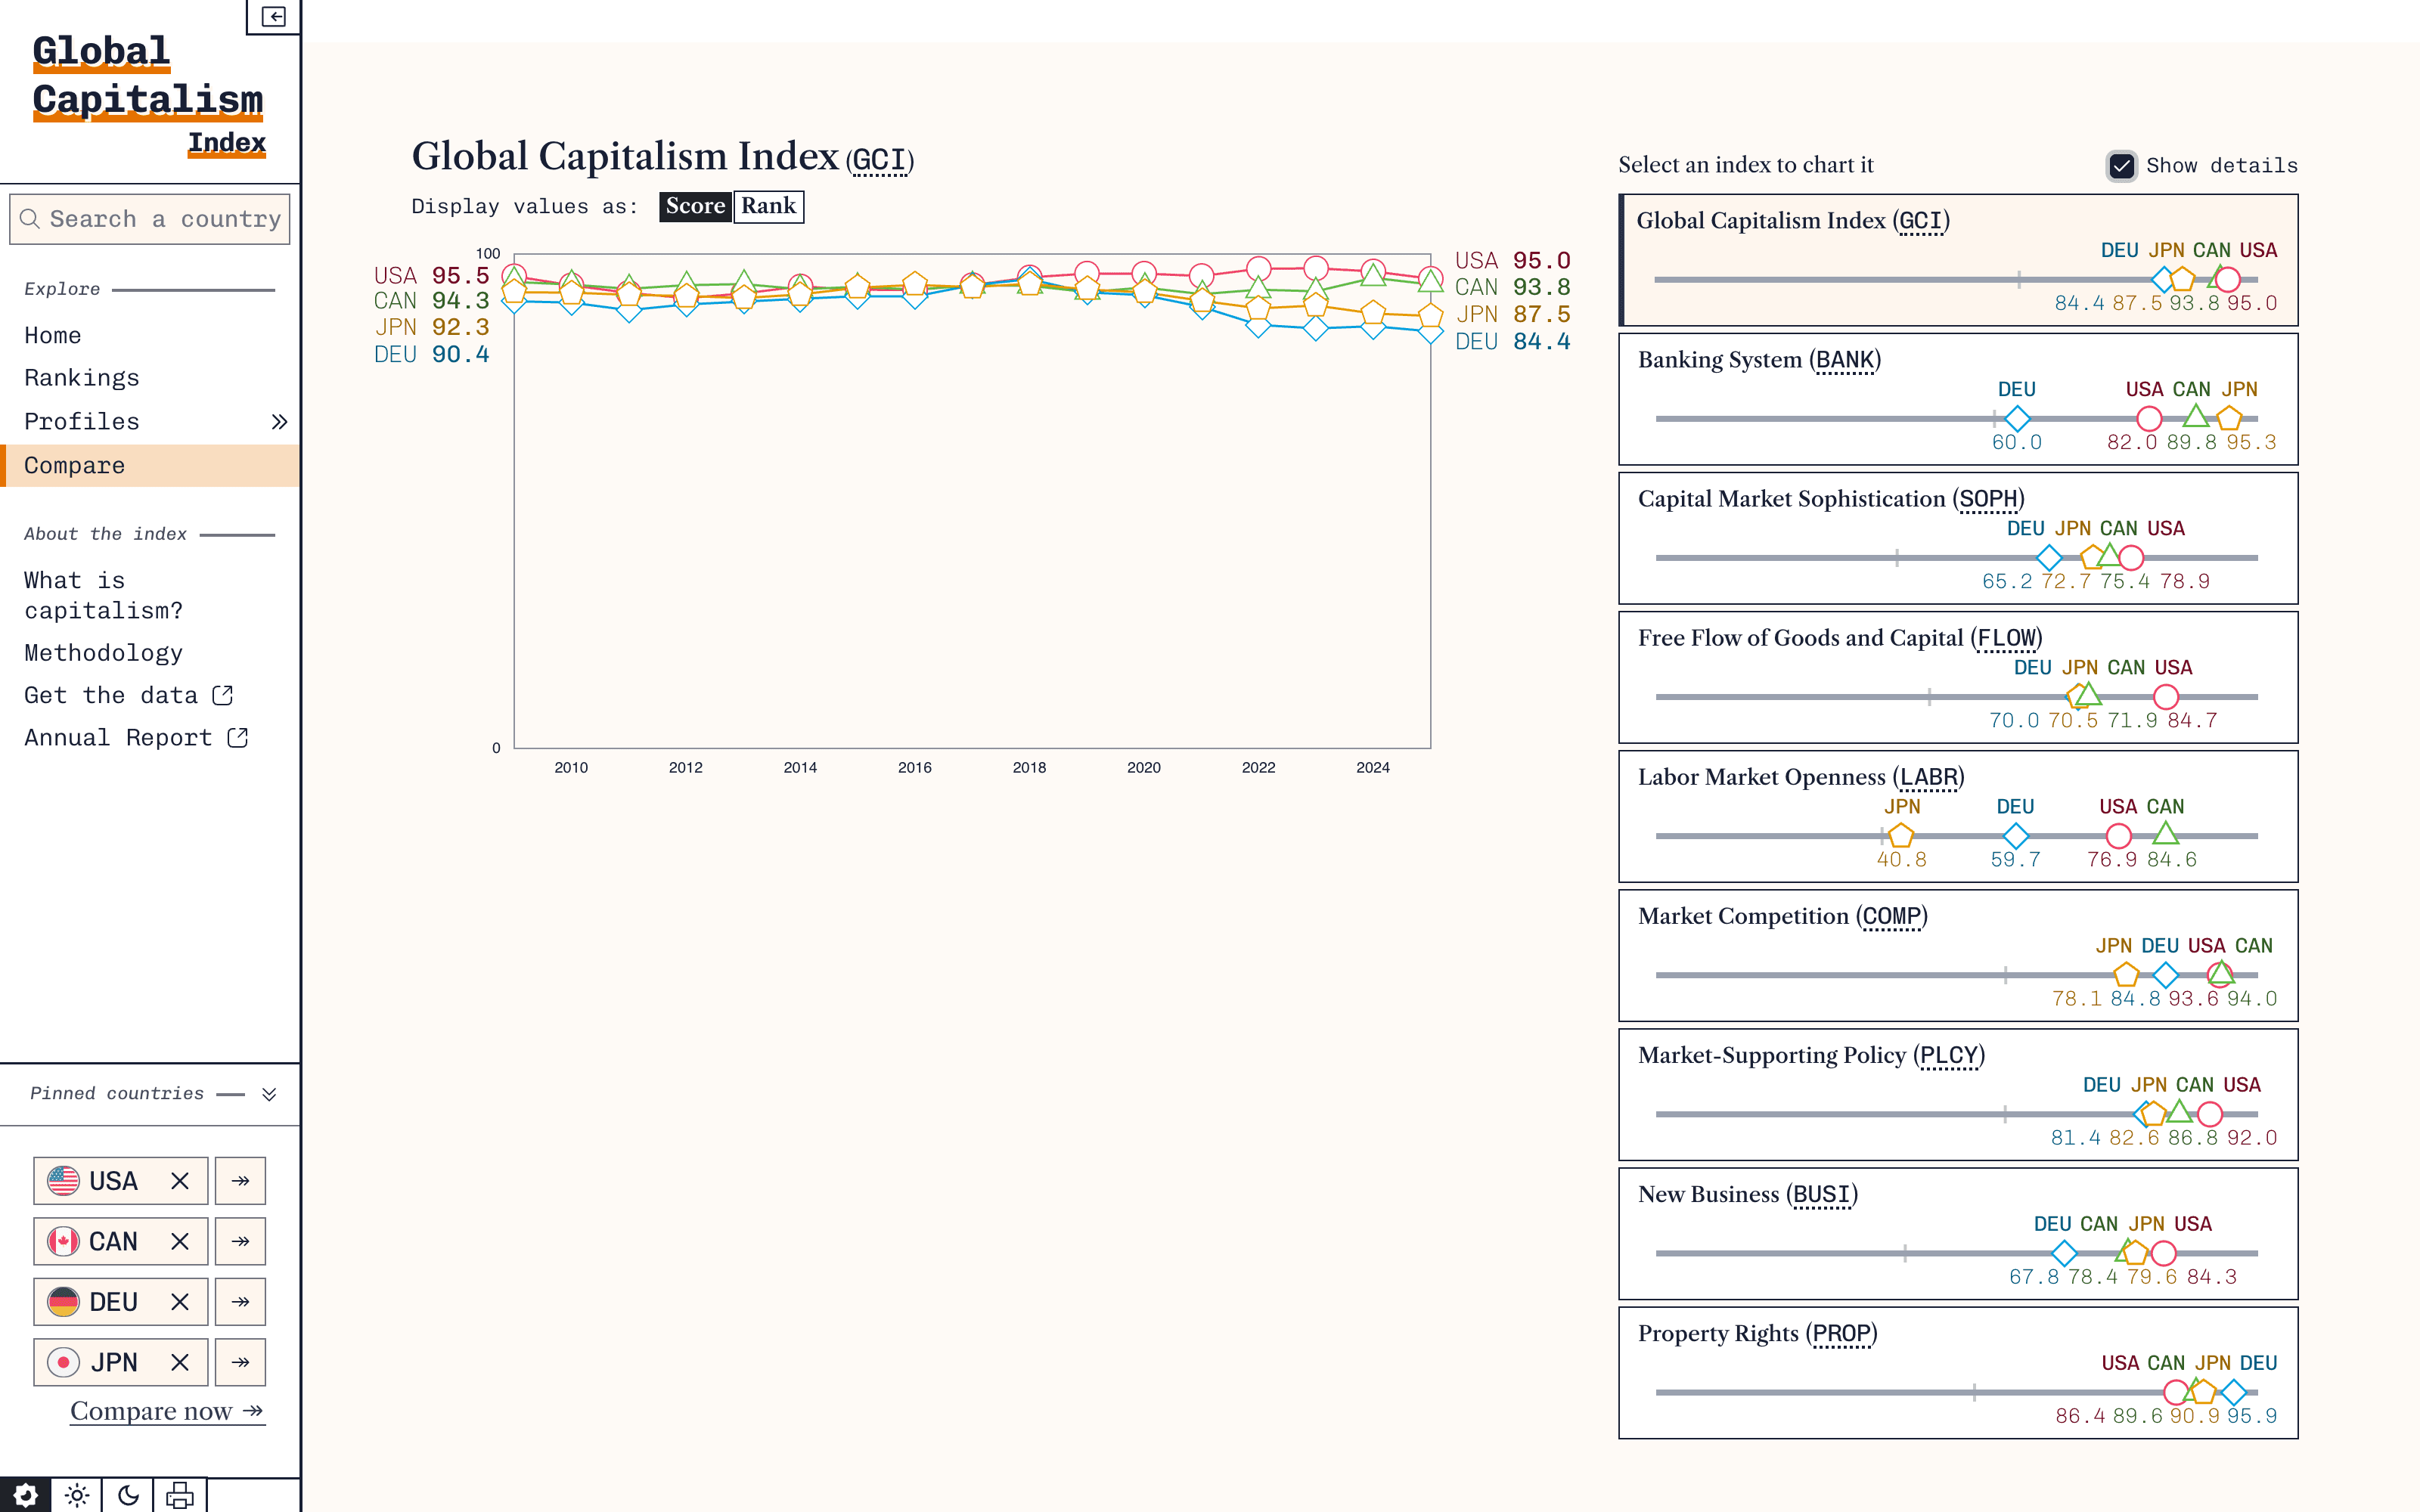
Explore how countries differ across the dimensions of the Global Capitalism Index.
Turning research into an experience
The challenge was to make a substantial body of research accessible to policymakers, business leaders, journalists, researchers, and the public, while preserving the detail needed to investigate the findings.
Darkhorse’s contribution was to turn the index into an experience that connects the overall rankings with country profiles, comparisons, and trends. Visitors can begin with a broad overview, then explore the dimensions behind a score and consult the methodology to understand how it was constructed.
The platform lets users:
Explore country rankings and scores
See performance across the eight dimensions
Compare countries directly
Examine changes over time
Consult the methodology behind the index

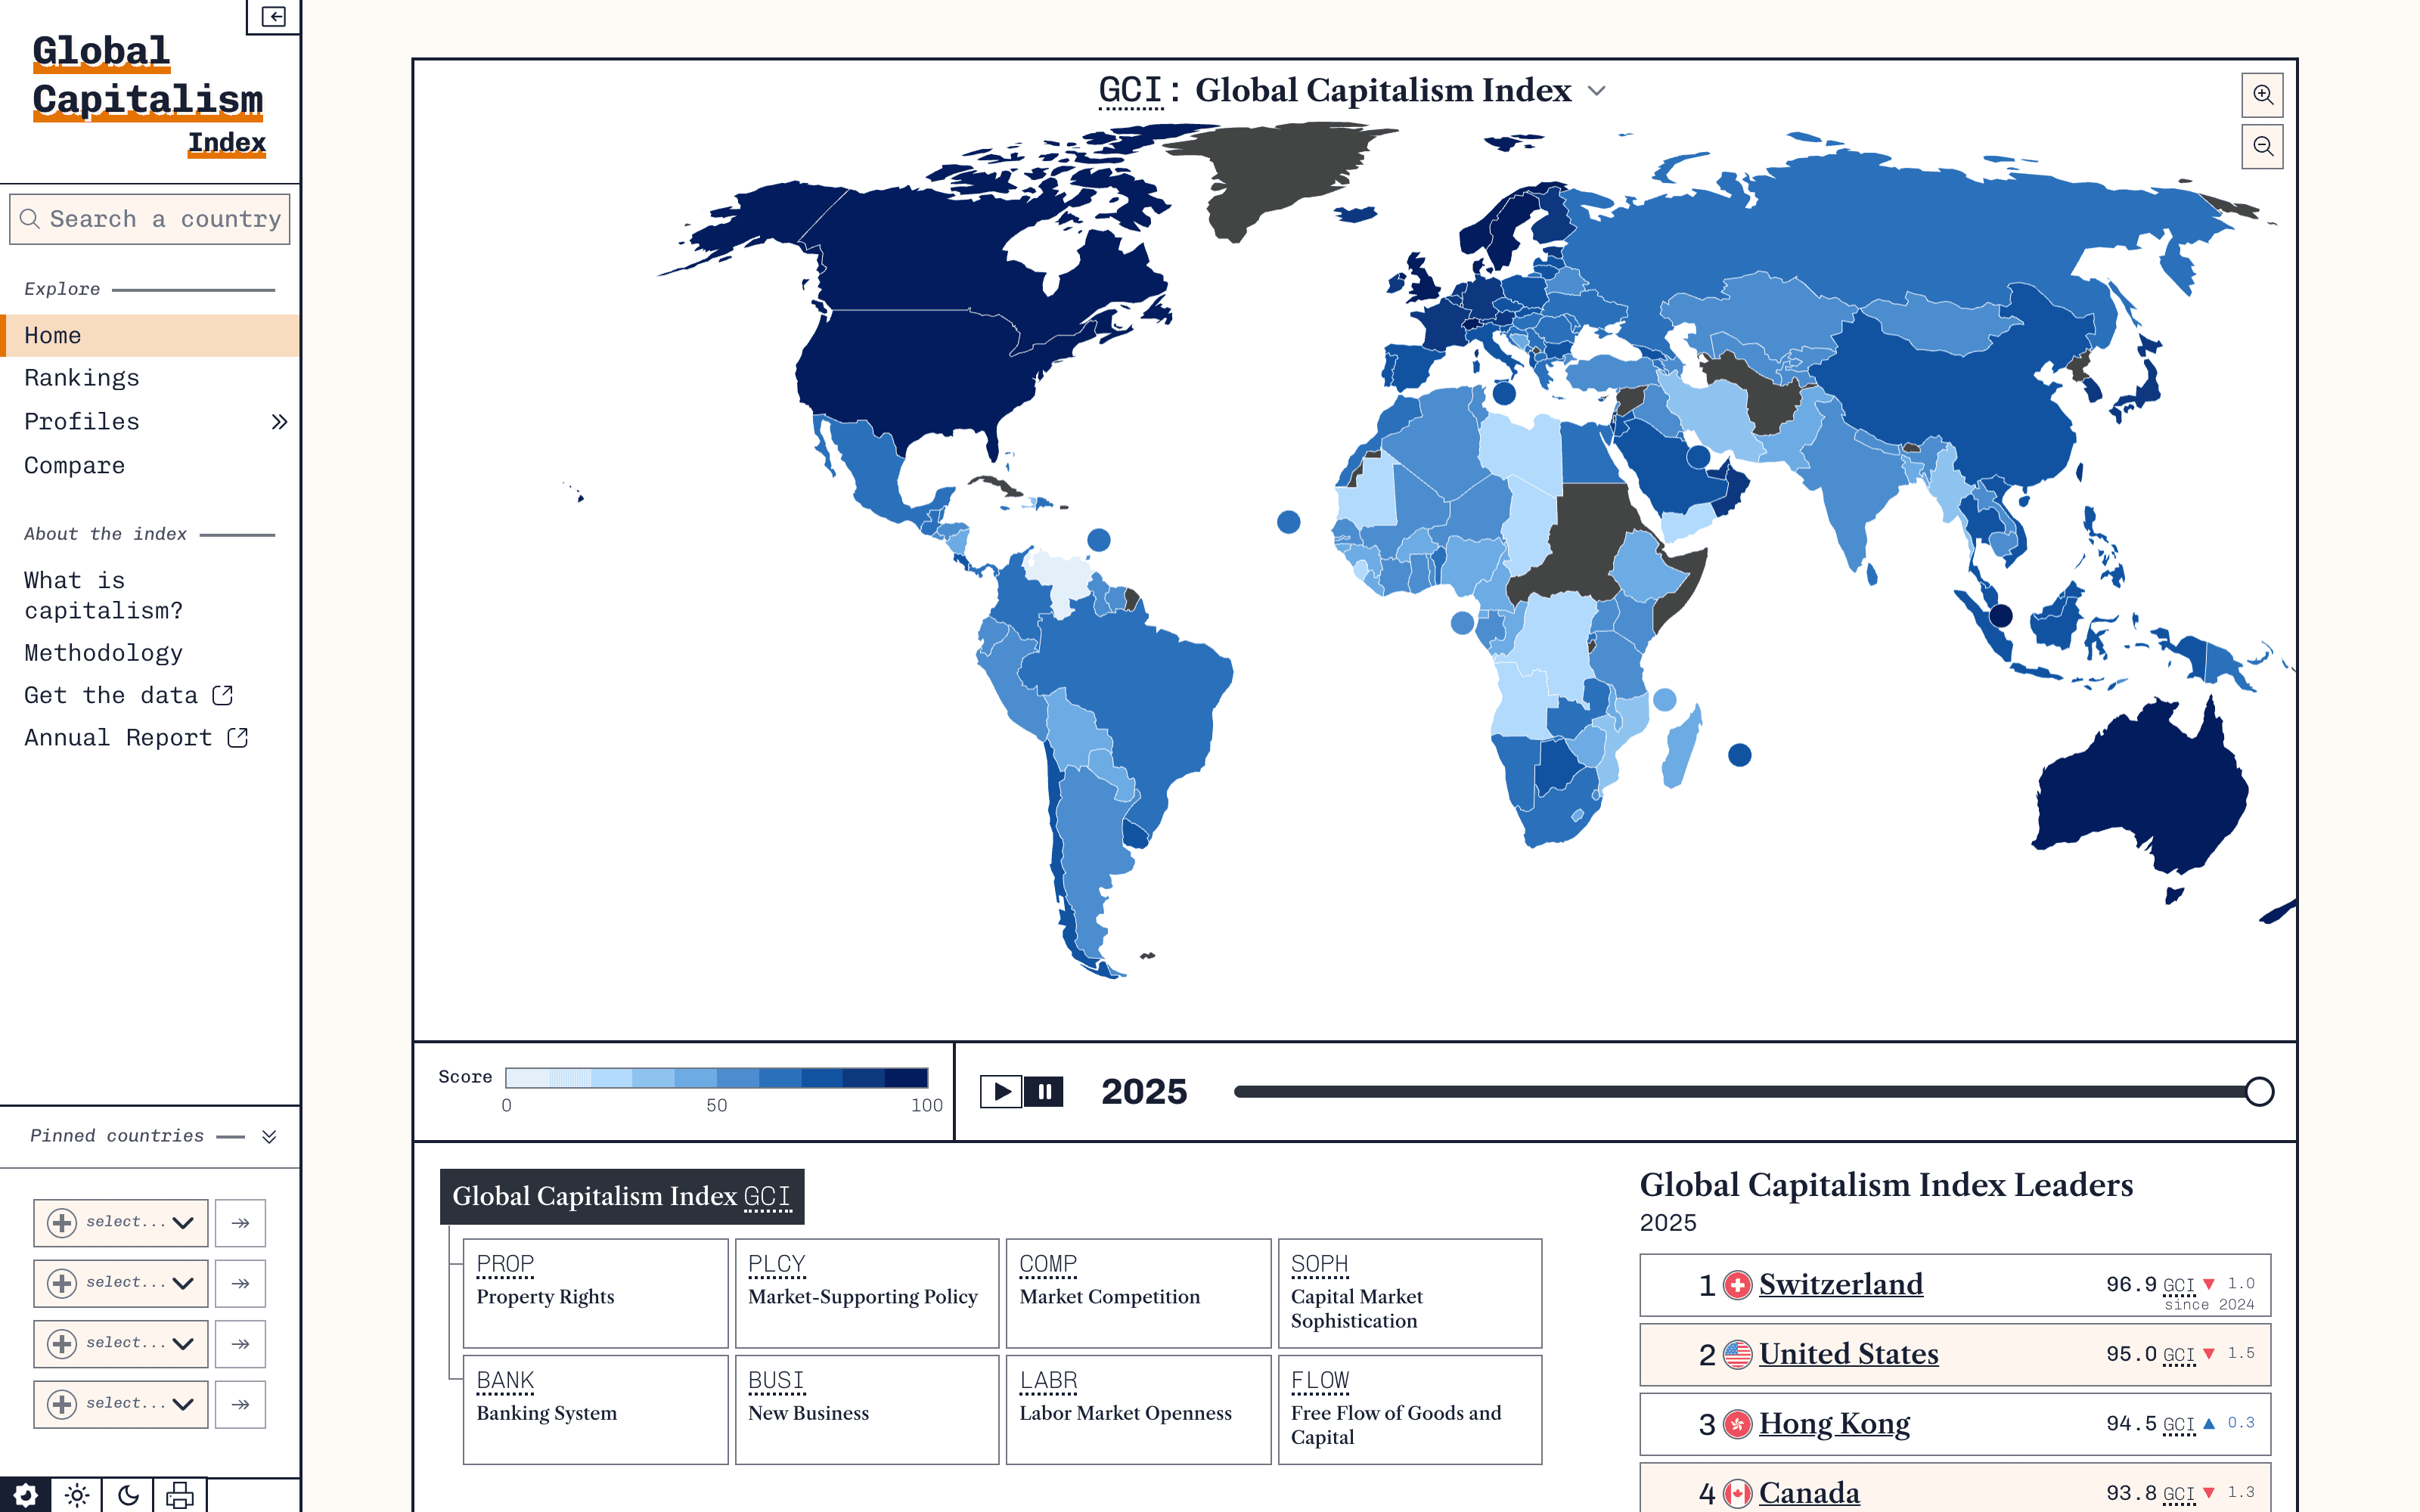
The world map shows 2025 scores for 170 countries, with a timeline that replays every year back to 2009.
Research that travels further
For UVA, the platform gives the research a public home that people can share, revisit, and explore as the work develops. A headline ranking can draw attention; the interactive experience gives audiences a way to investigate what sits behind it.
That creates more opportunities for the research to enter public, policy, and business conversations, with the underlying framework available for readers who want to go deeper.
Exploration that goes deeper
Start with your own country. Compare it with a neighbor, investigate a surprising ranking, or see which dimensions have changed over time. Each step opens another question and another way into the research.
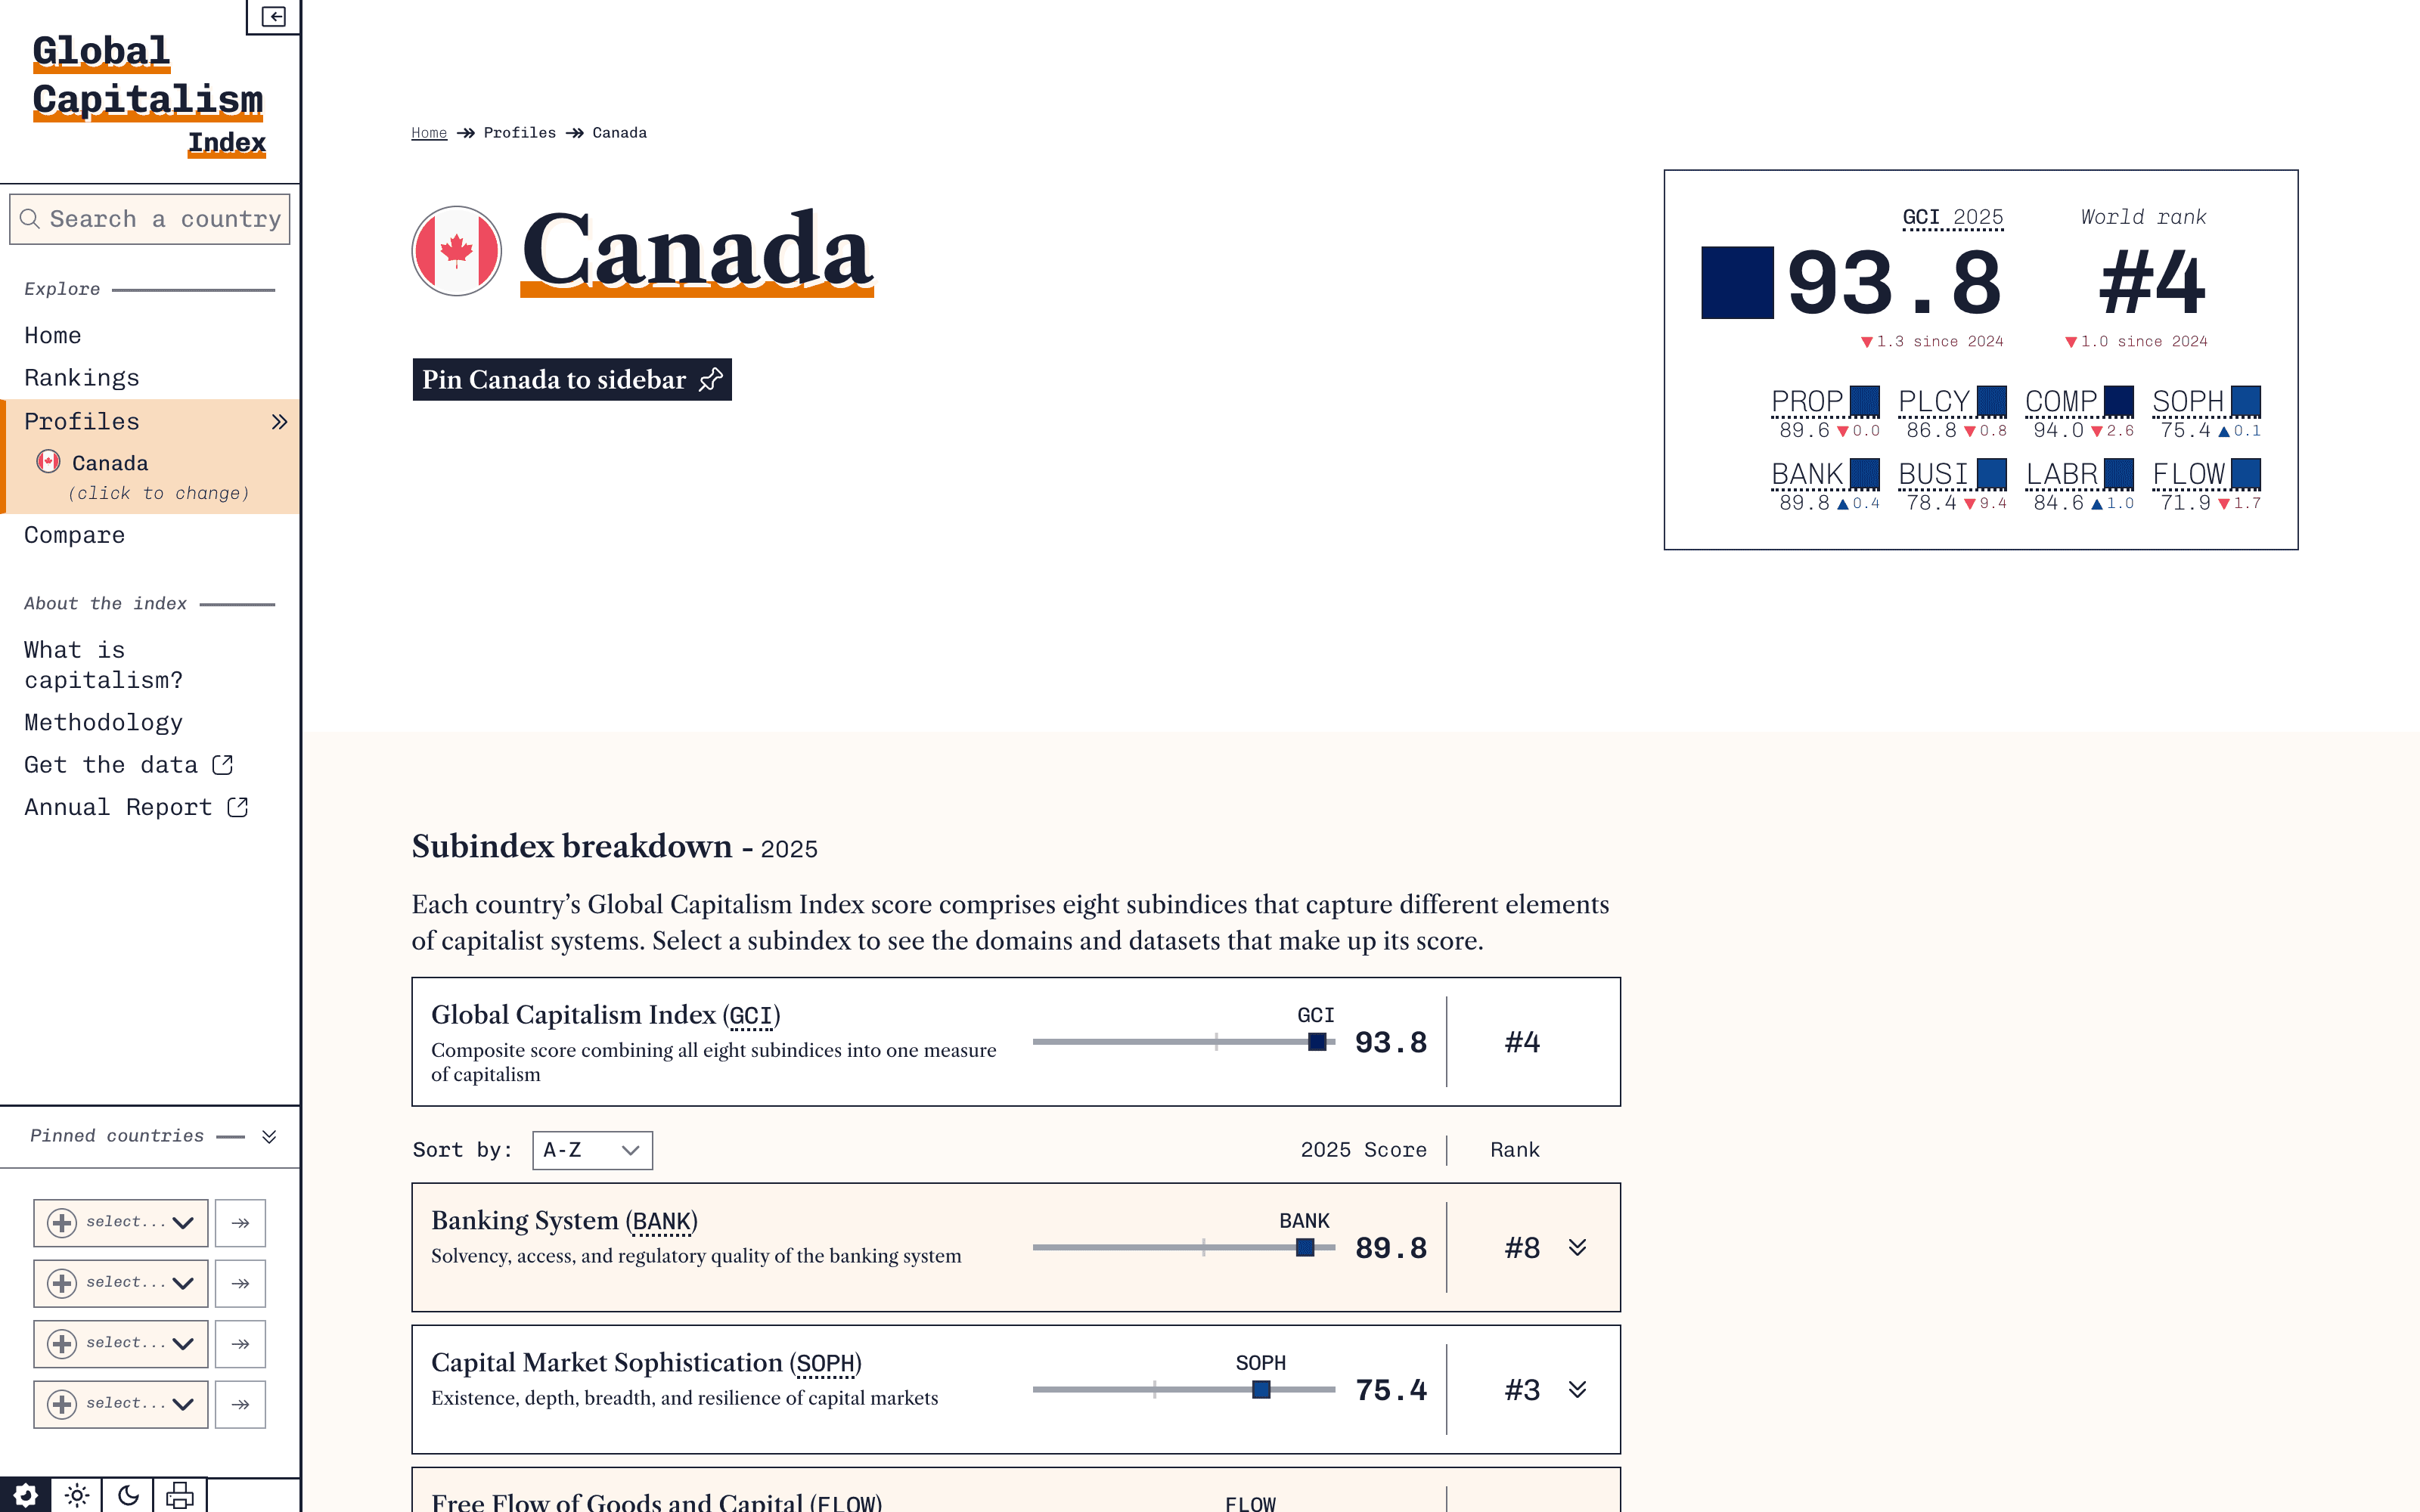
Each country profile pairs the headline score and world rank with a breakdown of all eight subindices.
For someone arriving with a specific question, country profiles and comparisons provide a useful starting point. For someone browsing out of curiosity, they offer a path from an initial discovery into deeper analysis.
UVA created the research framework. Darkhorse helped make it explorable.
Explore the Global Capitalism Index
Have research you want more people to understand and use? We’d be glad to discuss how an interactive experience could help.
More From the Blog