
How Darkhorse Visualization helped turn population health research into an interactive resource for exploring differences between communities.
Darkhorse Visualization
Oct 29, 2026

The Nova Scotia Health Atlas addresses a question with practical consequences: How does health vary depending on where people live?
A collaboration between researchers at Dalhousie University, Nova Scotia Health, and the Department of Health and Wellness, the Atlas brings together data on population characteristics, health determinants, behaviours, and outcomes. It gives people a way to see local patterns that provincial averages can hide.
Darkhorse Visualization helped bring that research to the web through an expanded and redesigned platform where visitors can explore communities, examine health indicators, and move between geographic scales.
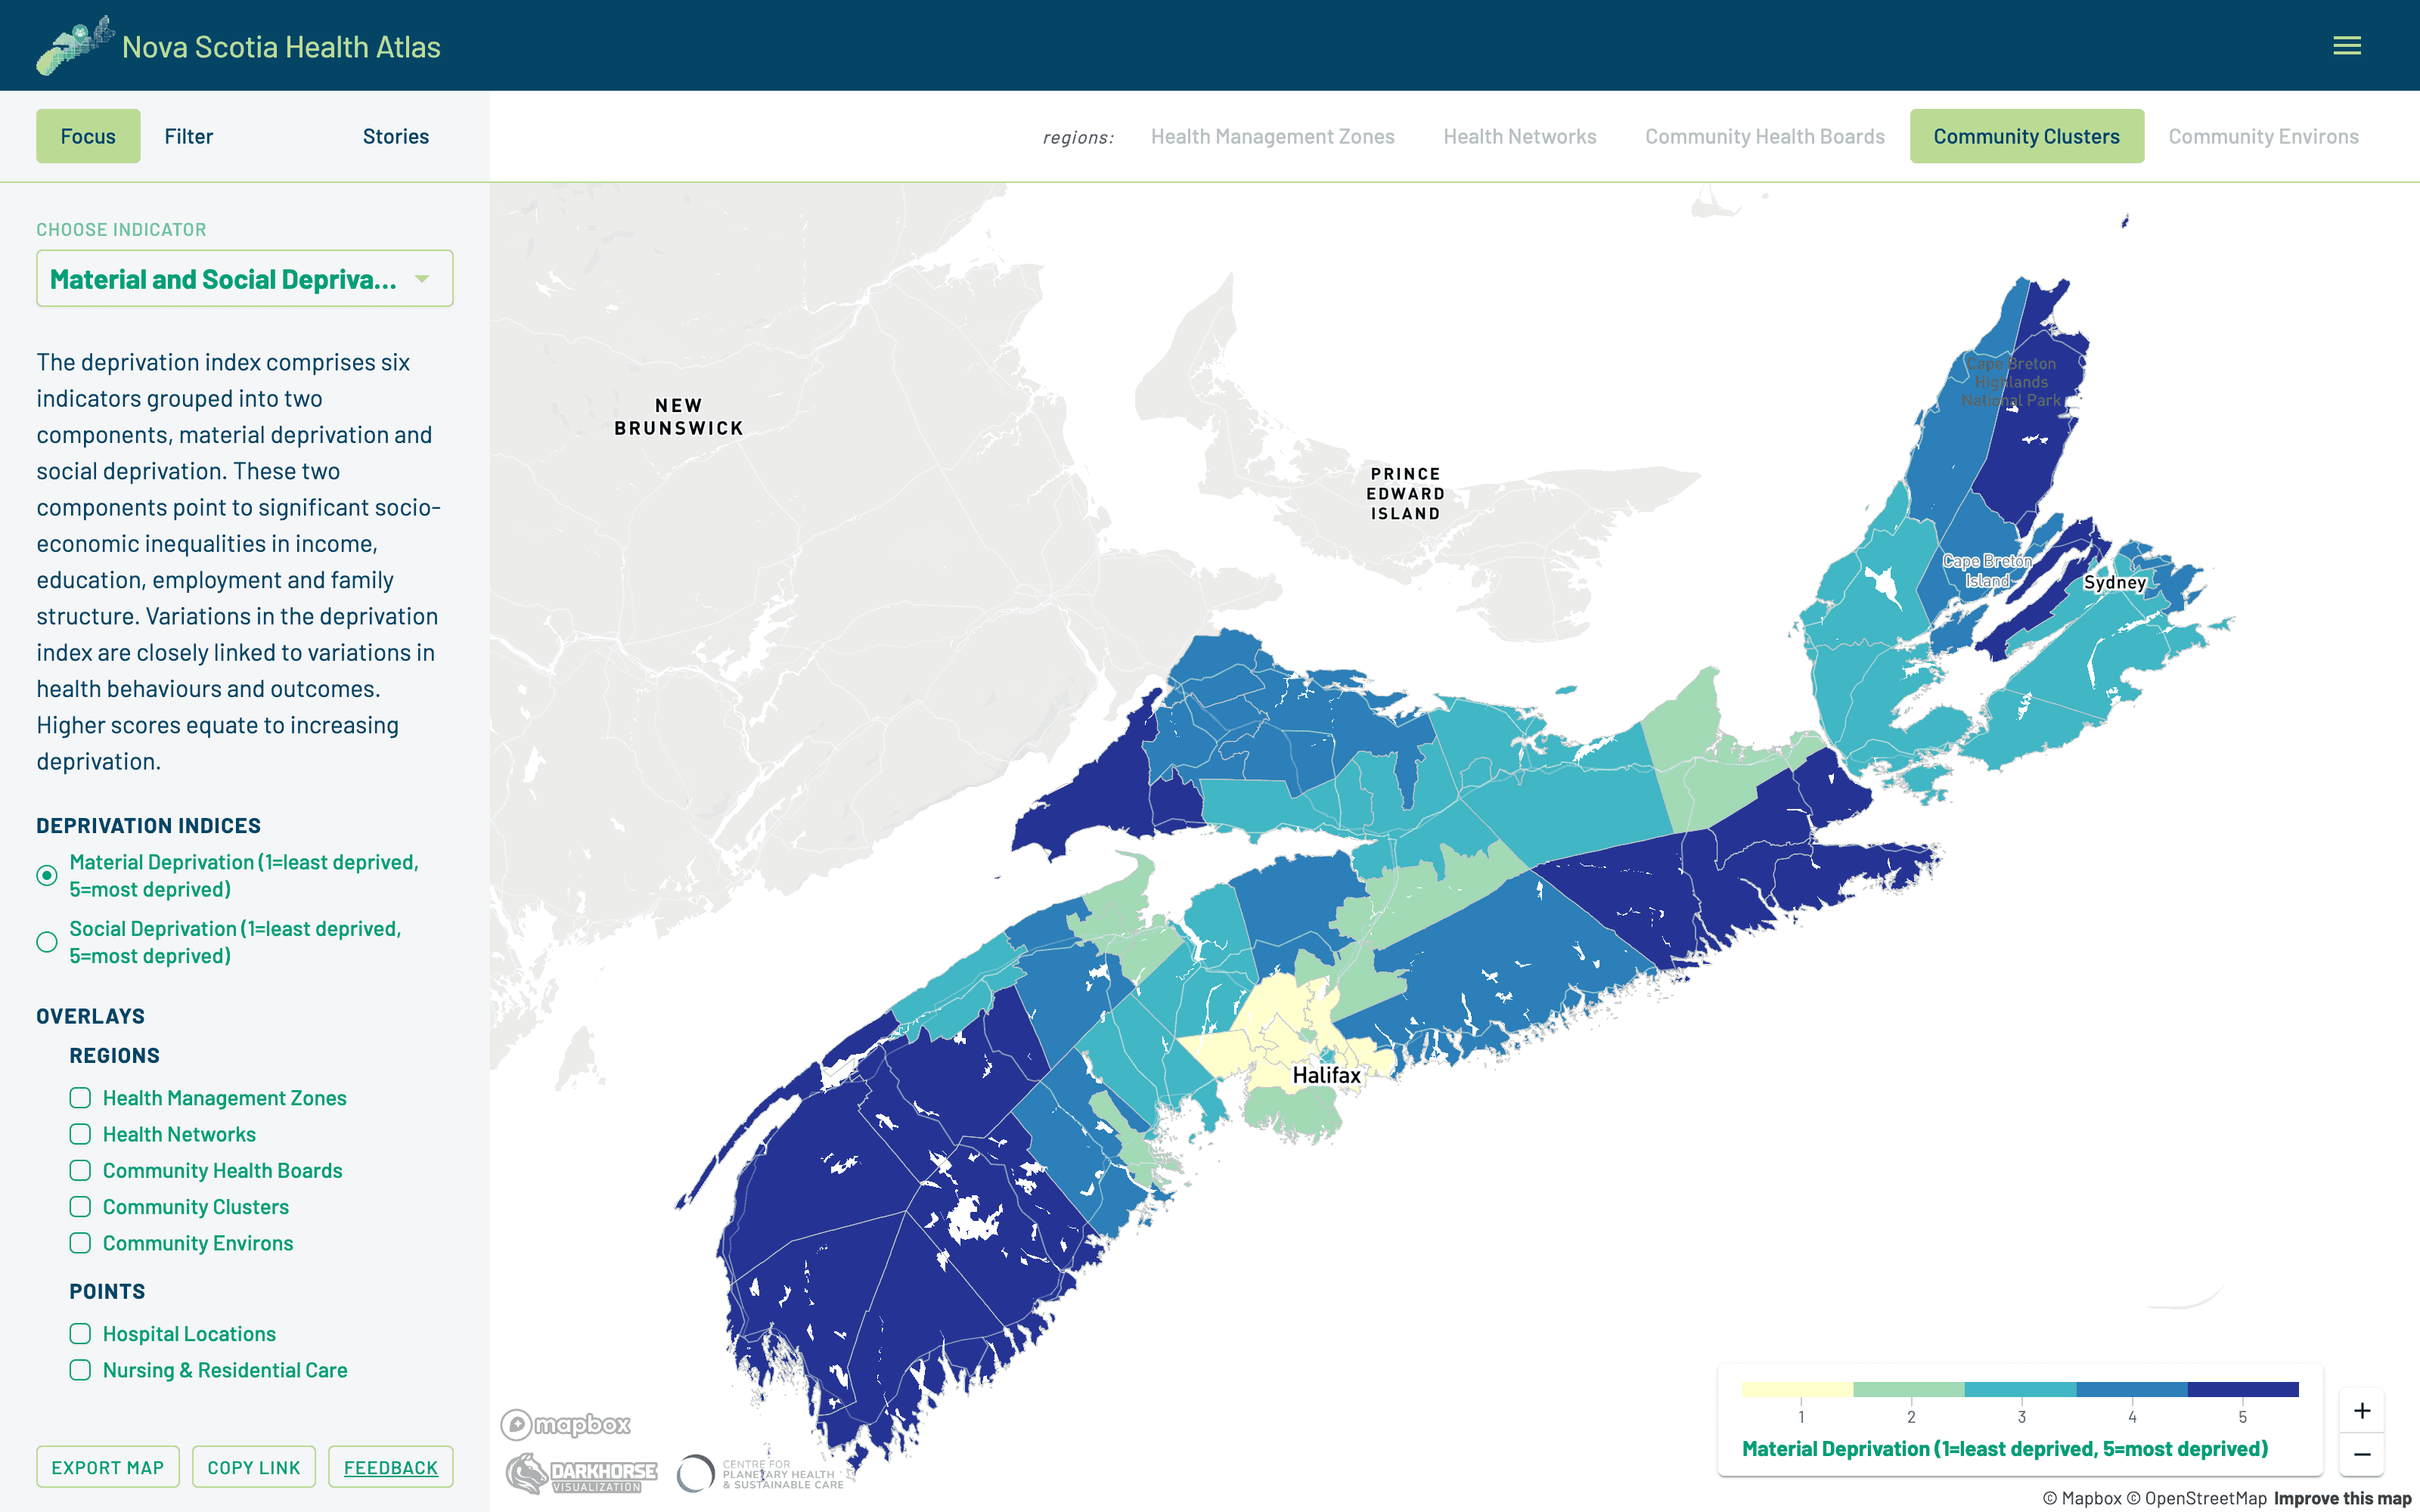
Explore how health and the conditions that shape it vary across Nova Scotia communities.
Turning research into an experience
The challenge was to make a substantial body of research accessible to people involved in health planning, policy, research, and community wellbeing, while preserving the context needed to interpret the findings.
Darkhorse’s contribution was to turn those datasets into an experience that connects a provincial view with local exploration. Shaped by user engagement sessions, the Atlas lets visitors choose an indicator, focus on a population, and explore the geography relevant to their question.
The platform lets users:
Explore population, social, environmental, and health indicators
Move from health management zones to smaller community areas
View age and sex breakdowns where available
Apply filters and overlay geographic boundaries and care locations
Consult explanations of the data, methods, and uncertainty
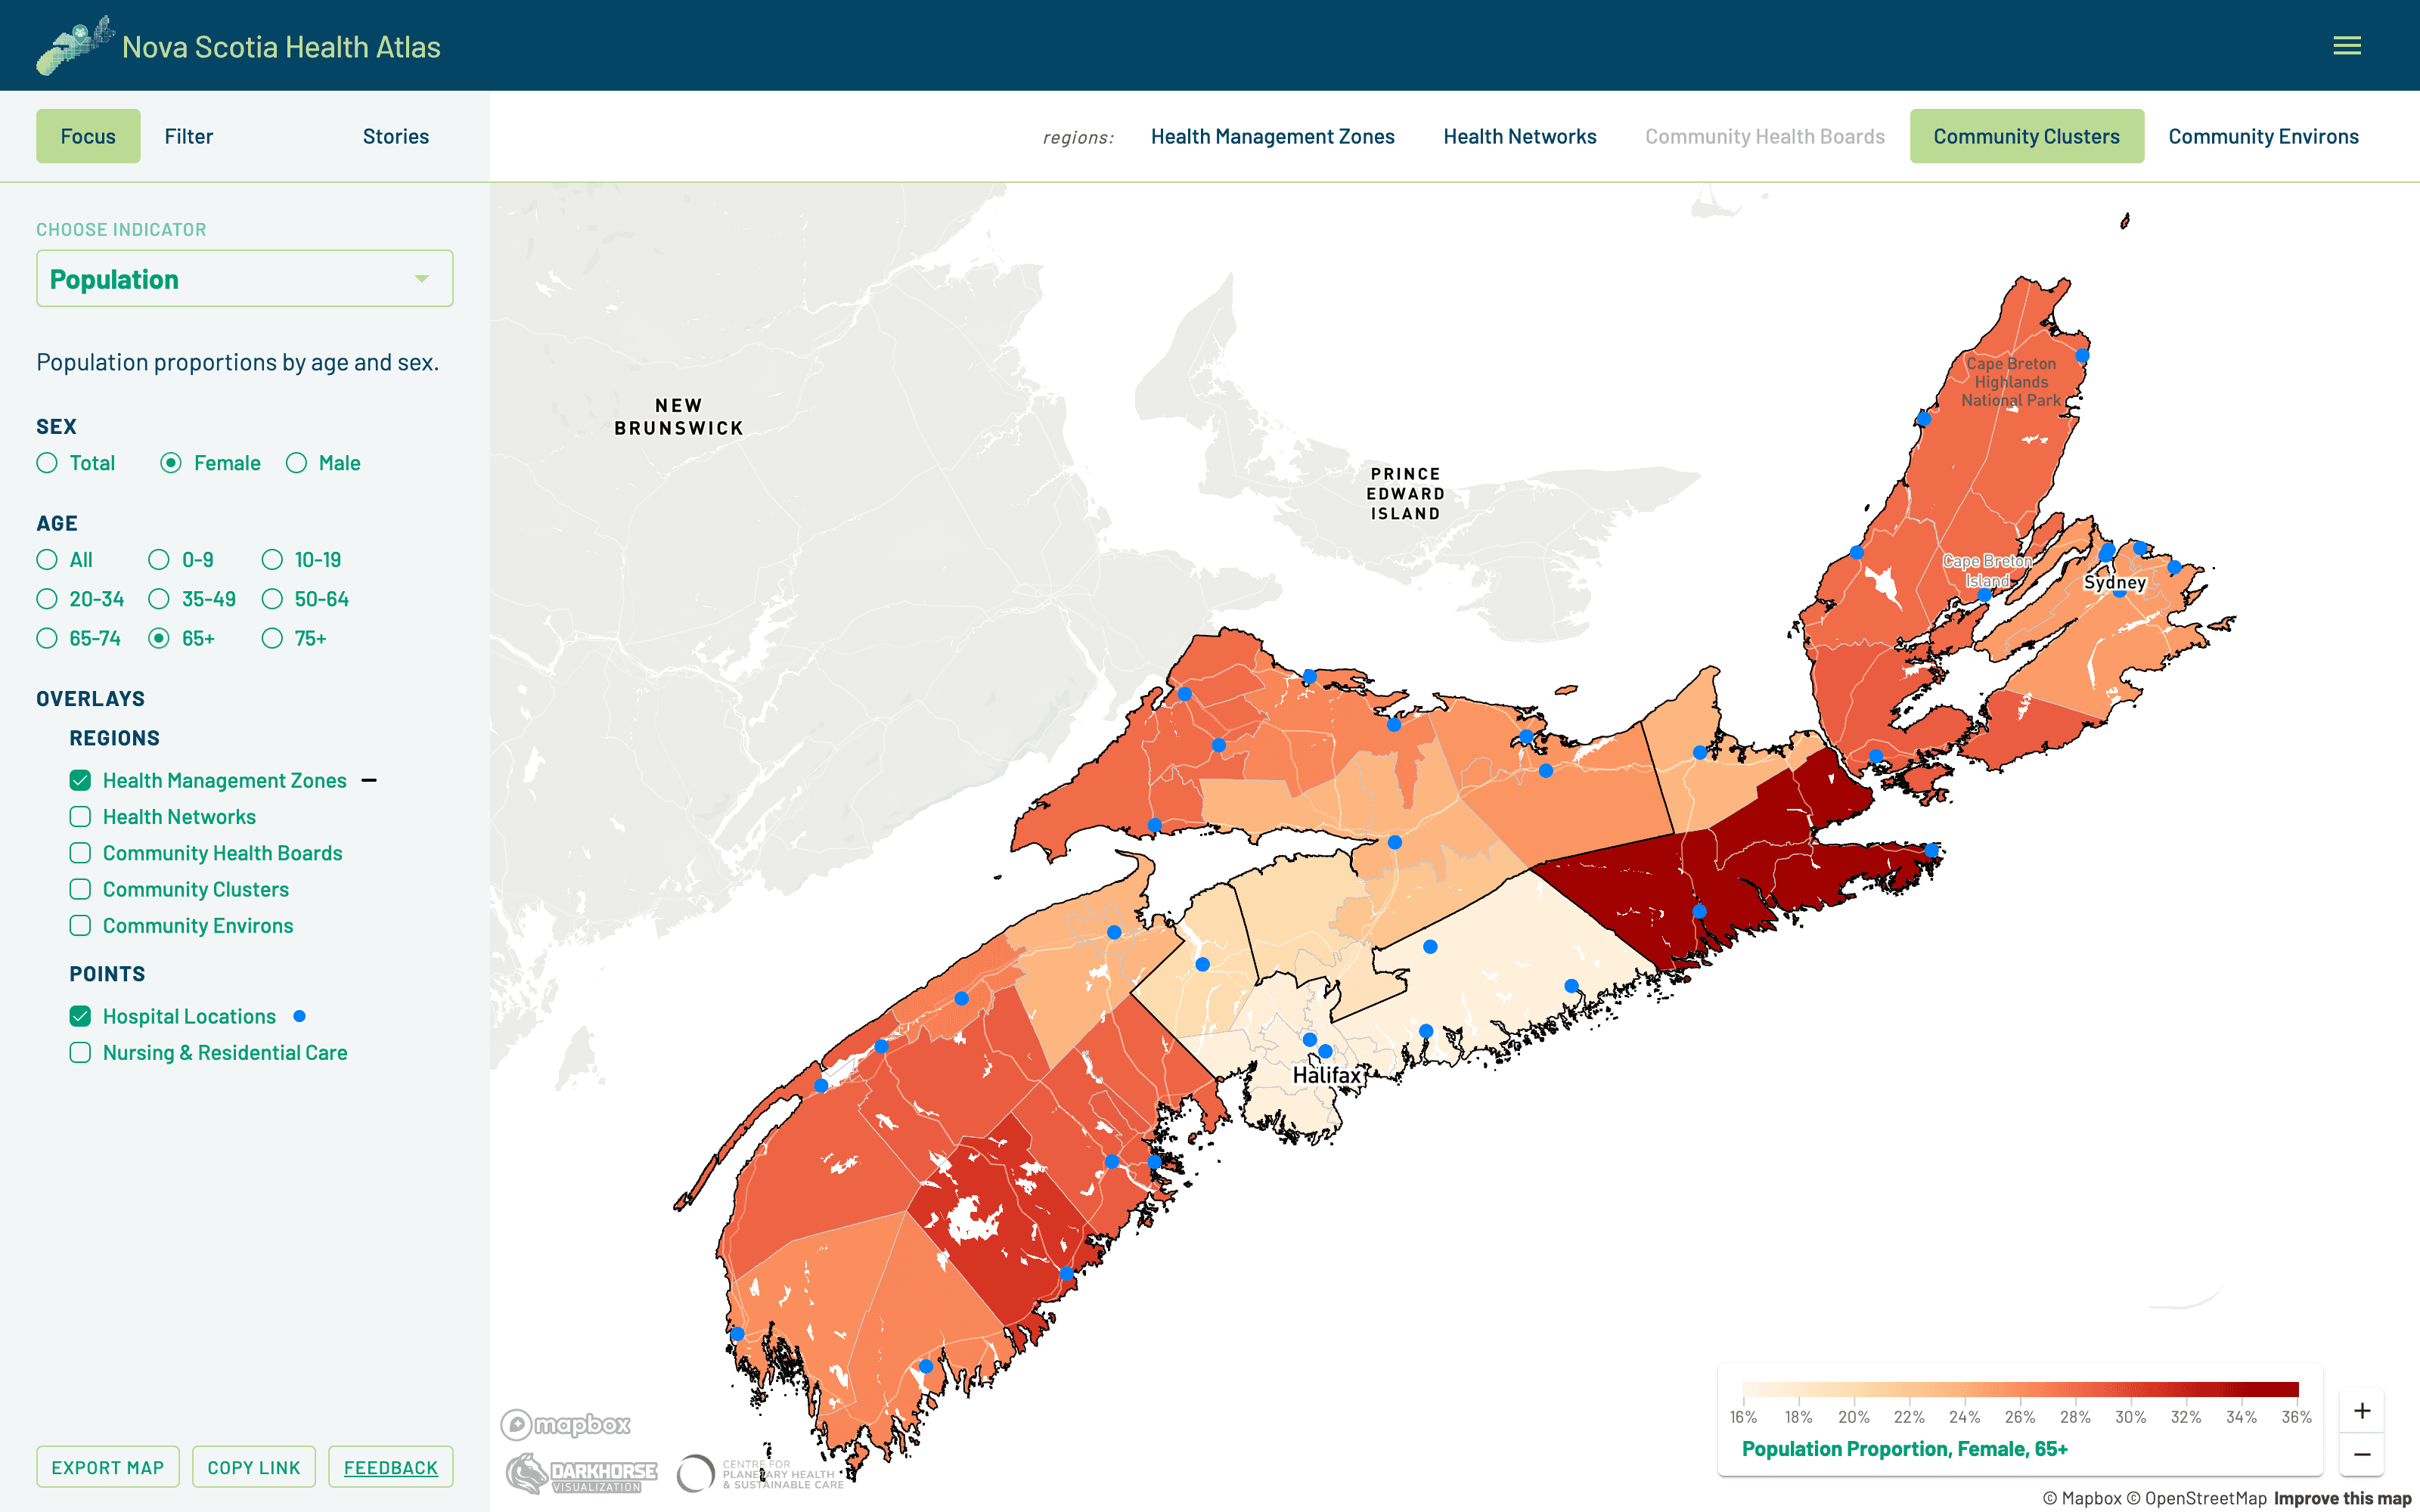
Focus on a population by age and sex, then layer in health management zone boundaries and hospital locations.
Research that travels further
For the Atlas team, the platform gives research from multiple sources a shared public home that people can revisit and explore as the work develops. Findings from census data, environmental observations, and health studies become accessible through a common geographic lens.
That creates more opportunities for evidence to inform conversations about where prevention efforts, services, and resources may be needed. The supporting explanations help users understand what the patterns mean, including why a community’s rate does not describe every individual living there.
Exploration that goes deeper
Start with a community you know. Explore its population, look at material security or smoking prevalence, or examine how a health outcome varies across the province. Each step opens another question and another way into the research.
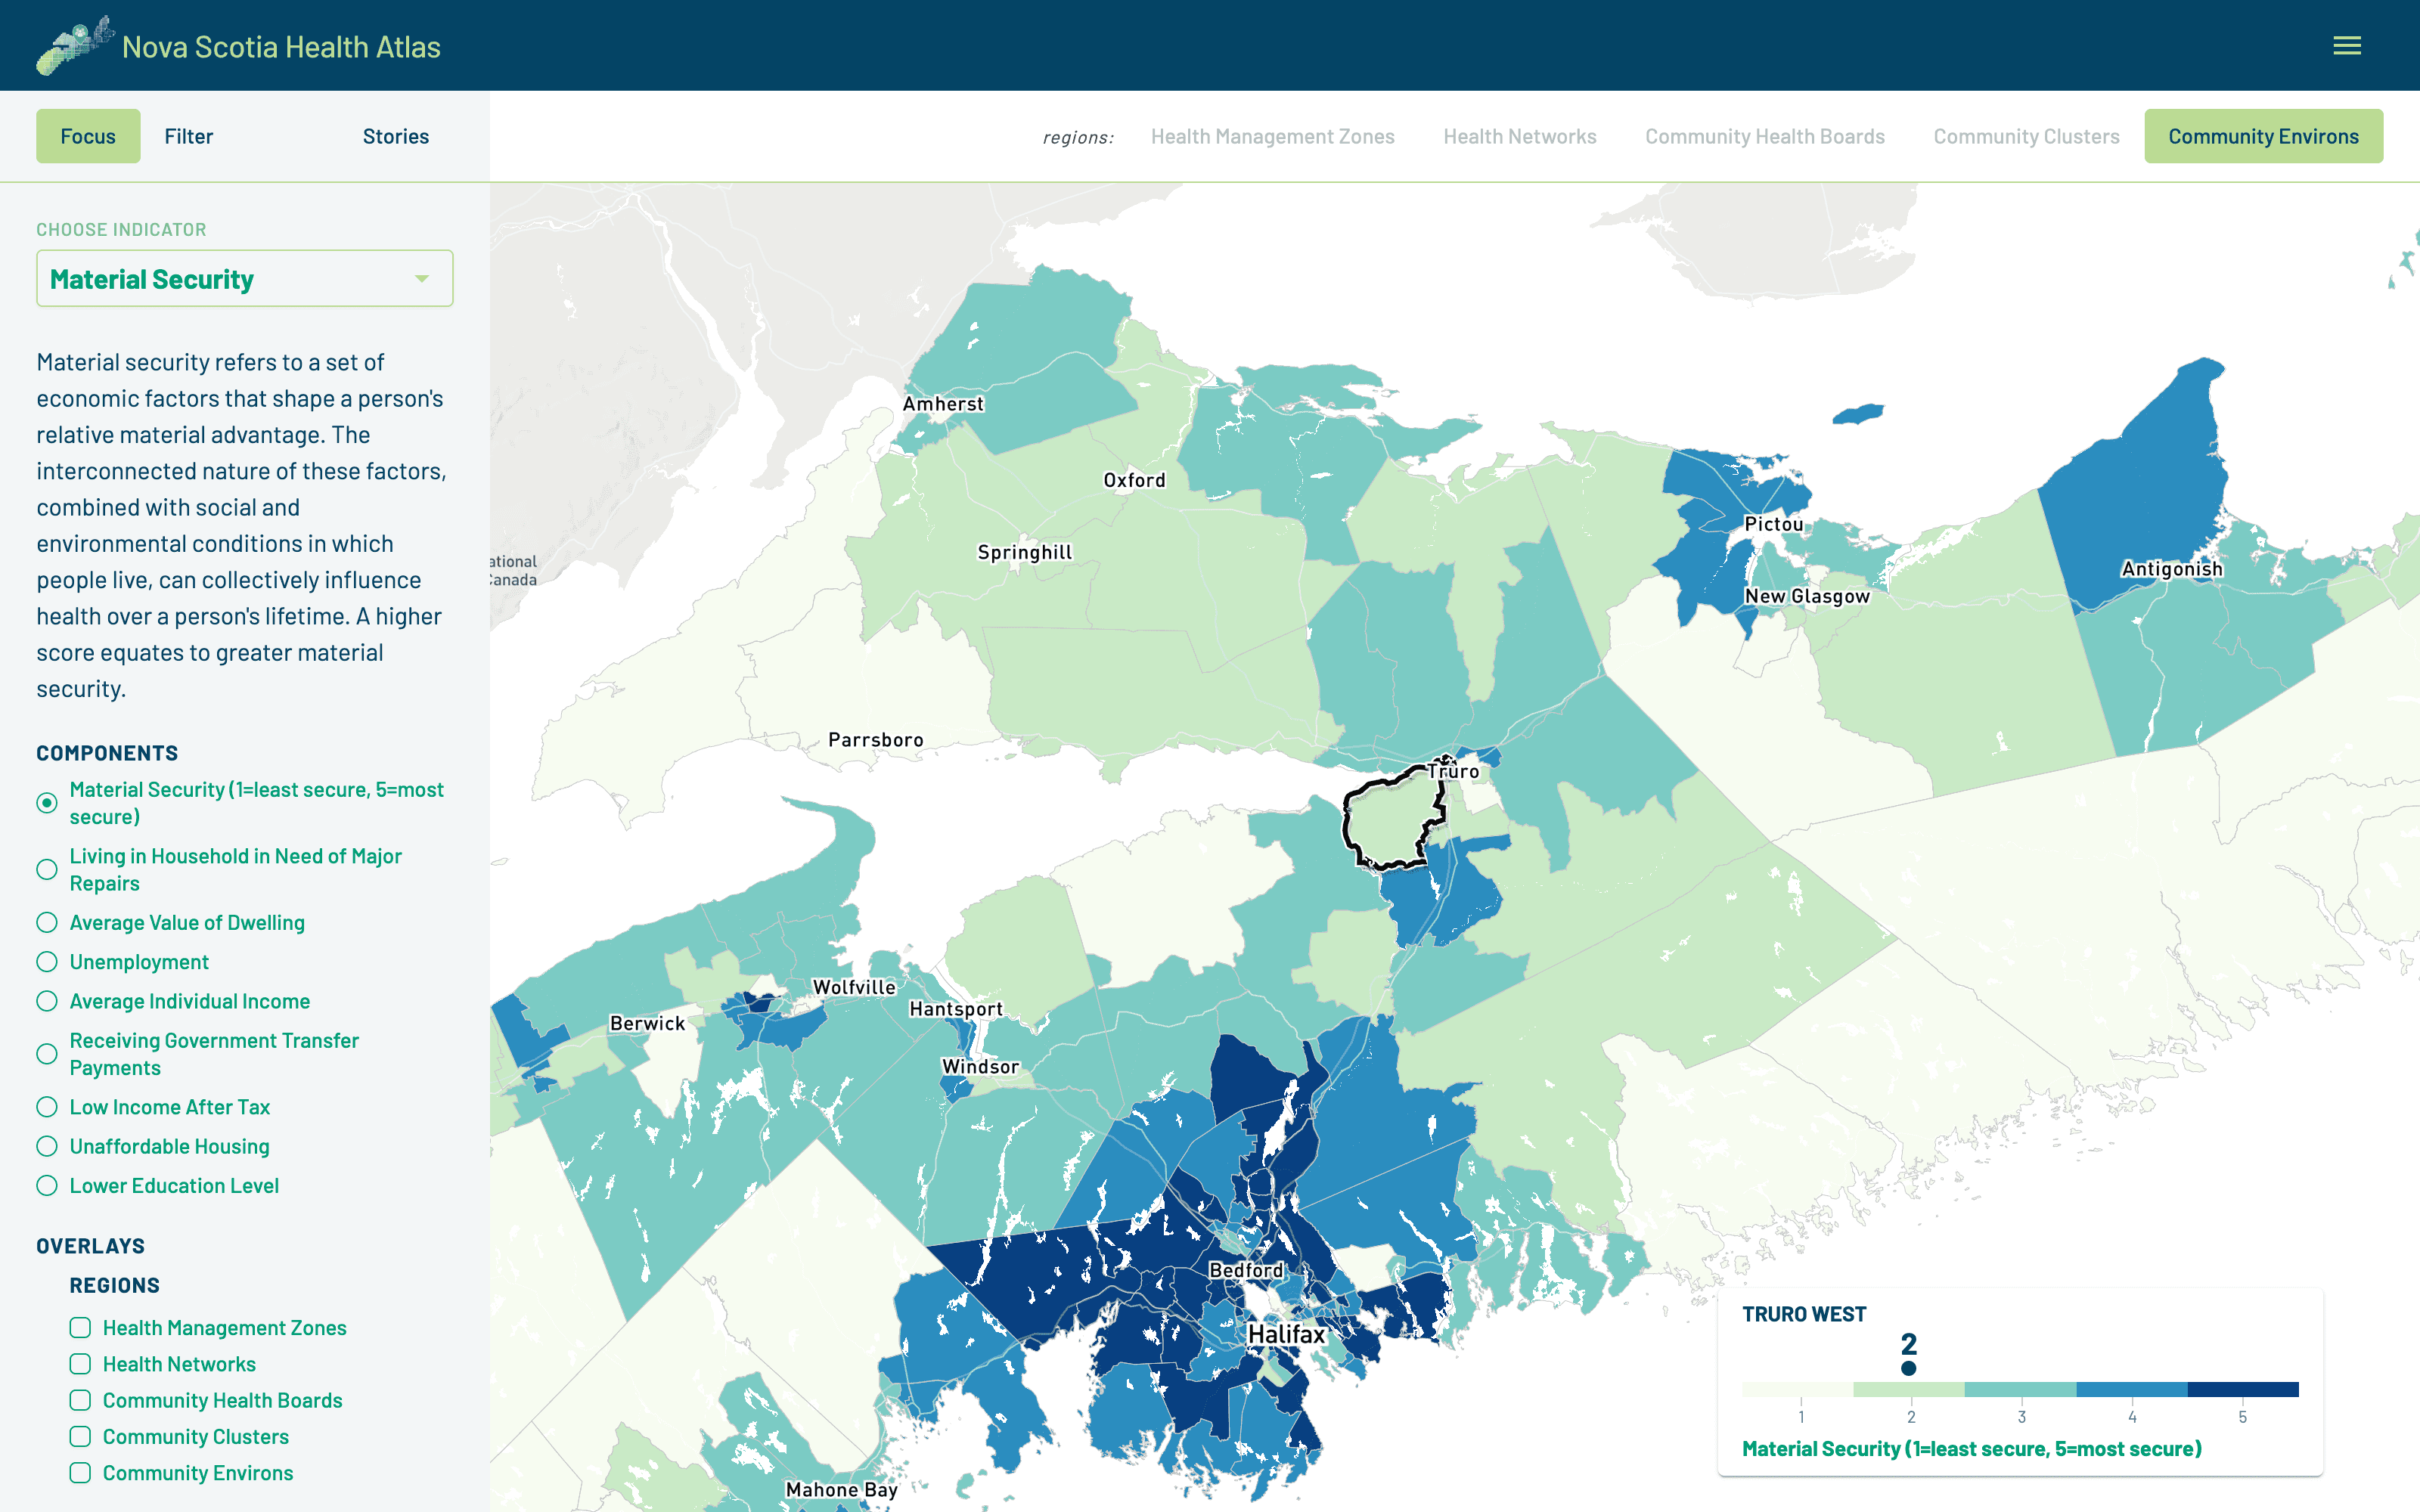
Zoom in to community environs, the Atlas’s finest geography, and select a community to see its score. Here, material security around Truro.
For someone arriving with a planning question, the geographic scales and filters provide a useful starting point. For someone browsing out of curiosity, familiar places offer a path into the broader conditions that shape health.
The Atlas team brought together the research and expertise. Darkhorse helped make it explorable.
Explore the Nova Scotia Health Atlas
Have research you want more people to understand and use? We’d be glad to discuss how an interactive experience could help.

More From the Blog